Ordinary Council: Attachments
26 February 2013 Page 1

14 February 2013
Shire of Esperance
Ordinary Council Meeting
26 February 2013
Attachments
Ordinary Council: Attachments
26 February 2013 Page 1
14 February 2013
Shire of Esperance
Ordinary Council Meeting
26 February 2013
Attachments
TABLE OF CONTENTS
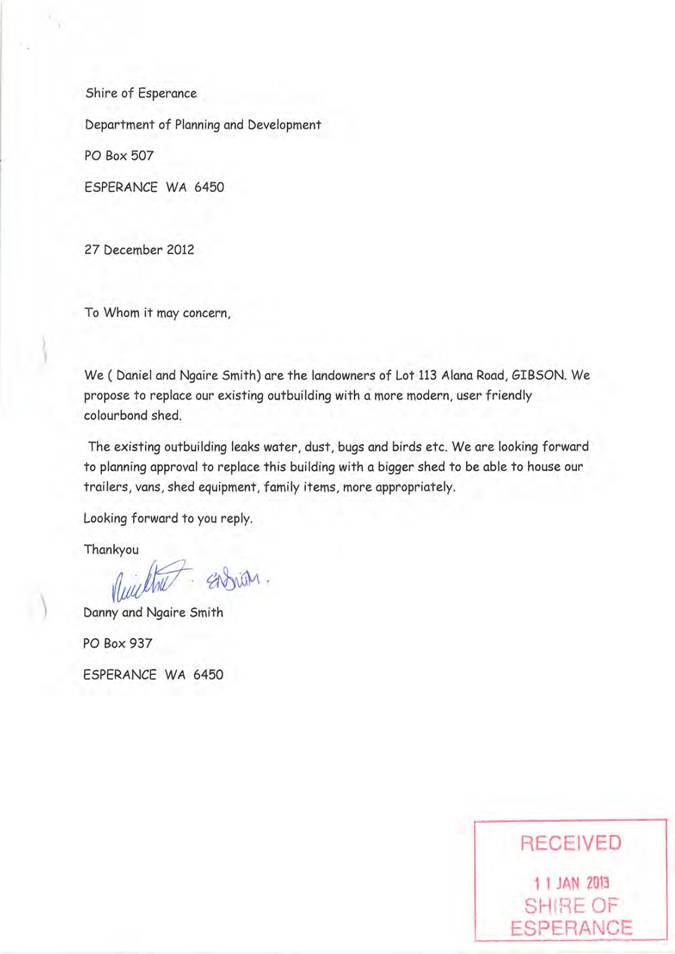
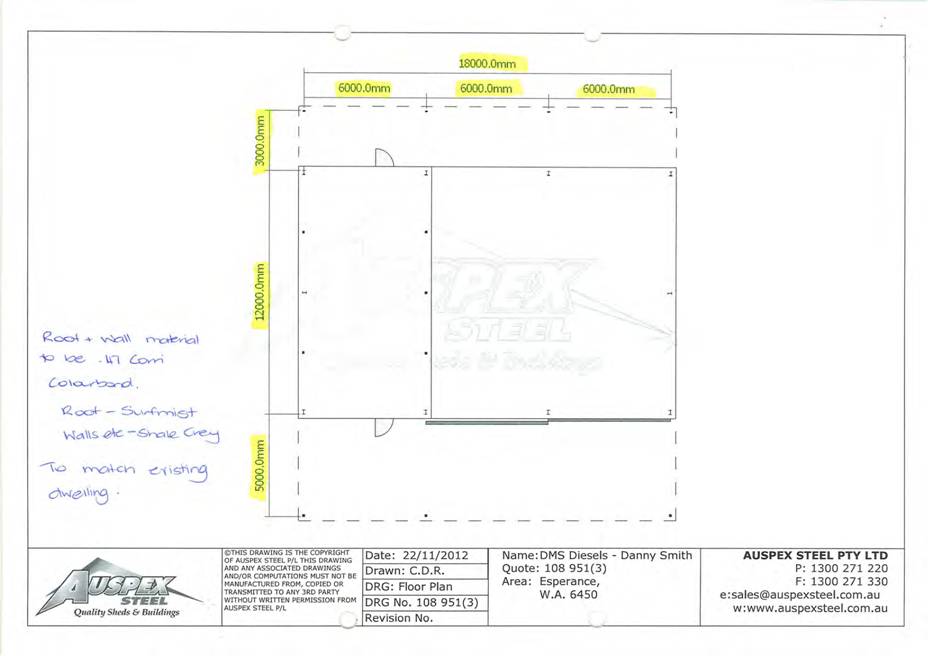
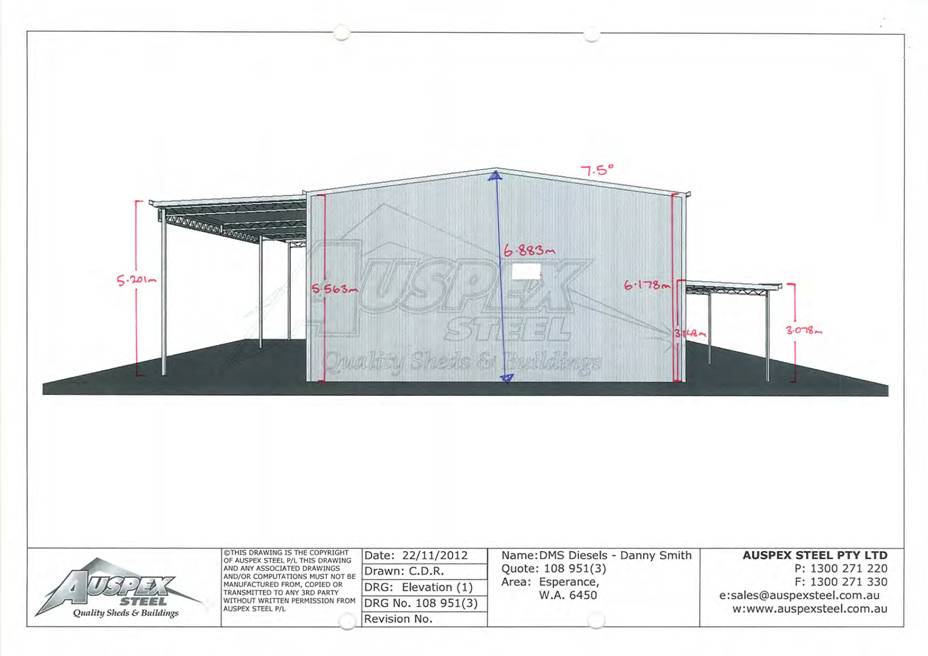
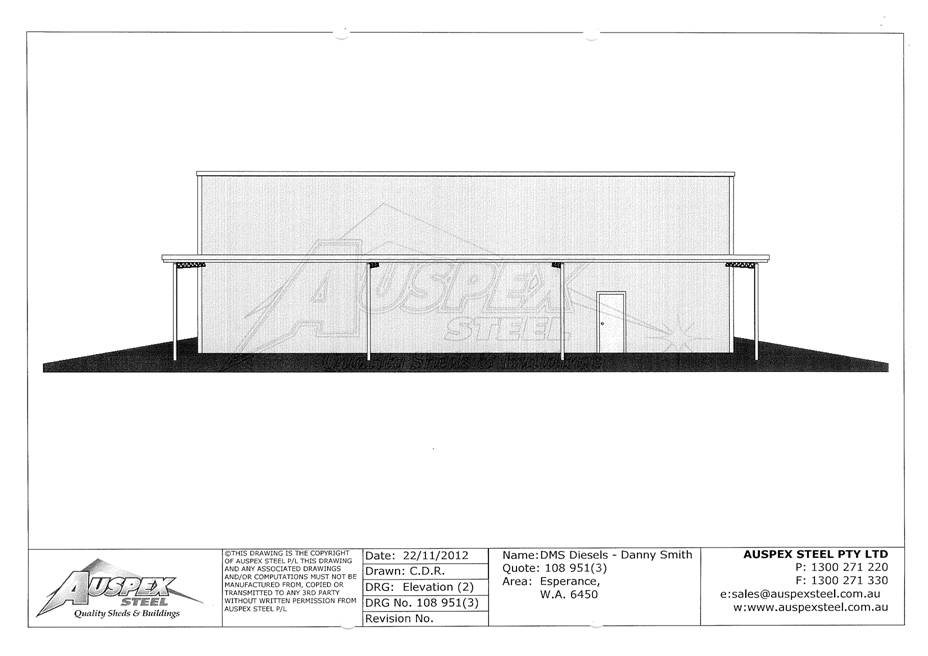
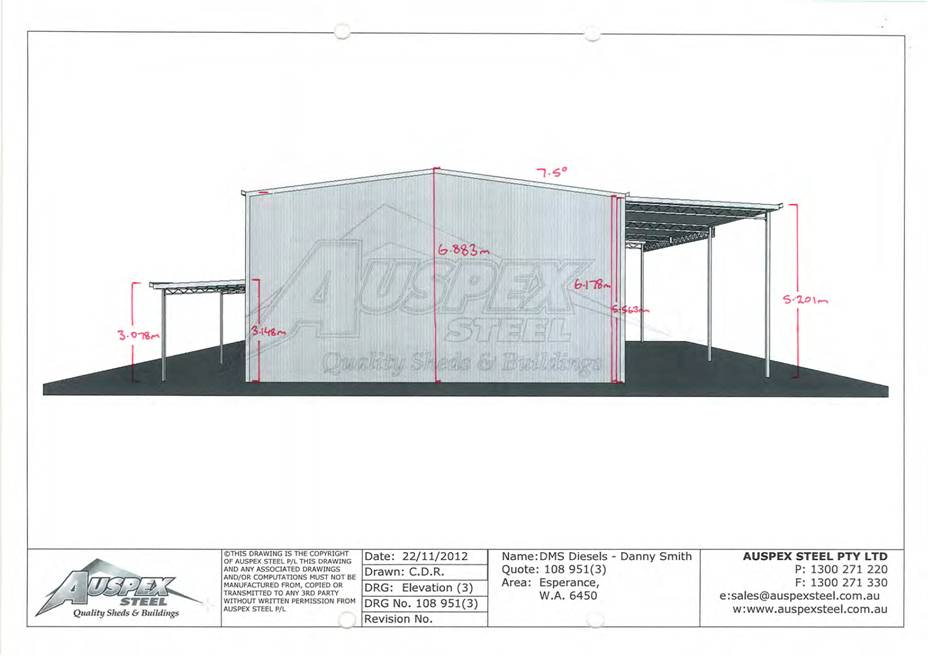
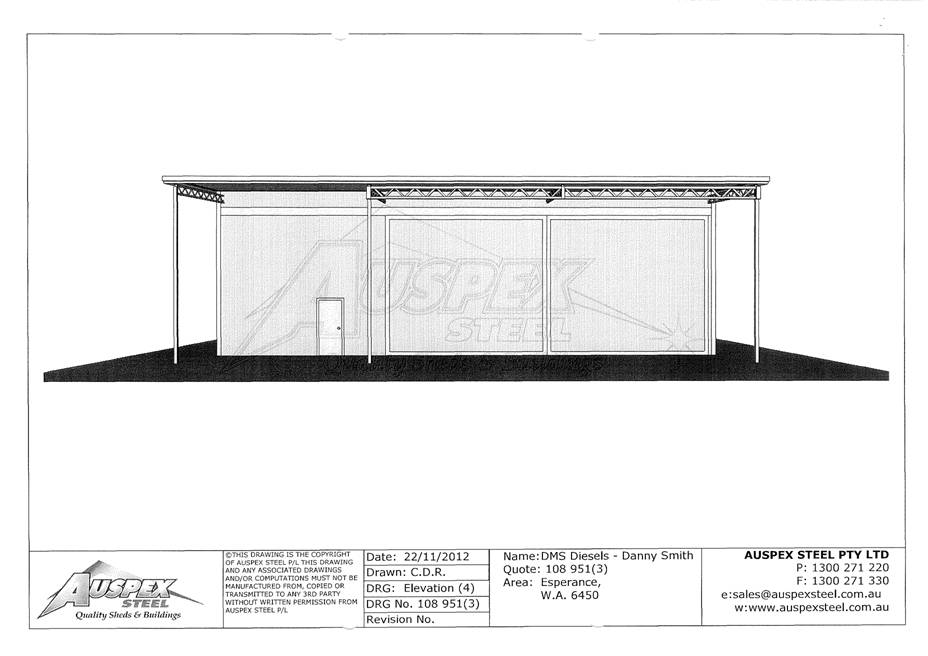
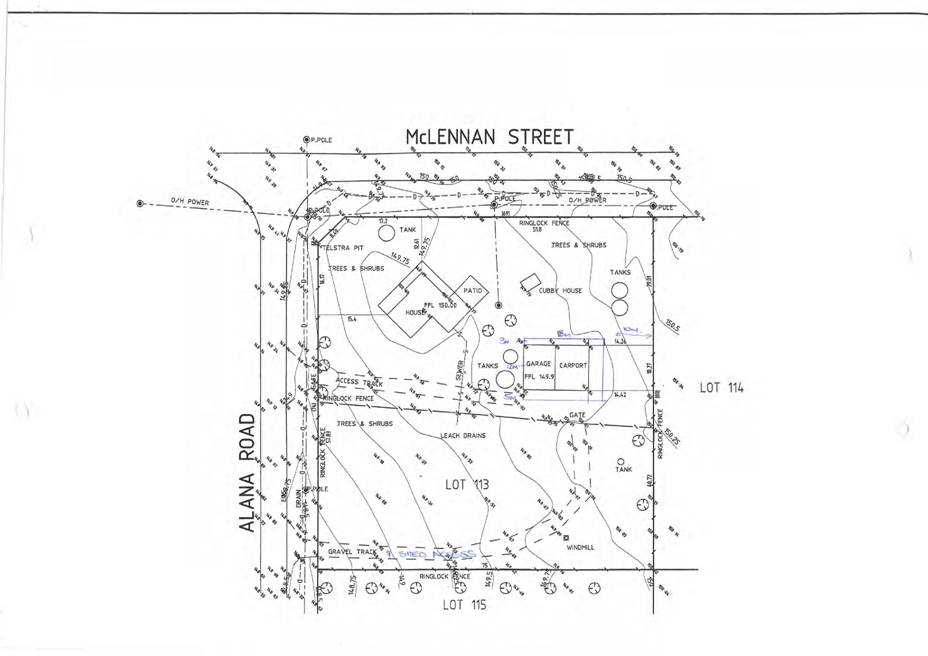
12.1.5 Development Application - Outbuilding on Lot 113 No 42 Alana Road, Gibson
Attachment a: Plans & Supporting Letter
12.2.1 Fleet Asset Management Plan
Attachment a: Fleet Asset Management Plan 2013
|
Attachment a.: Fleet Asset Management Plan 2013 |
Shire of Esperance

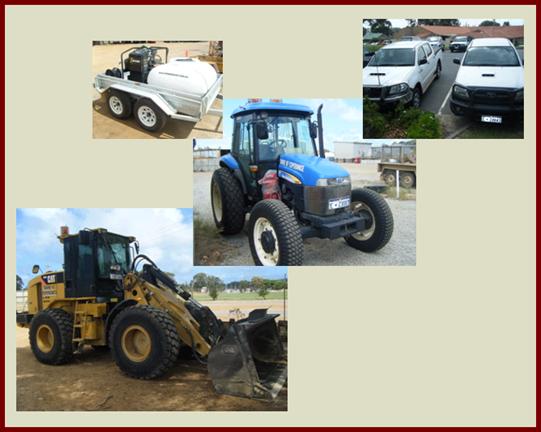
Fleet Asset Management Plan
|
January 2013
Document Control |
Asset Management for Small, Rural or Remote Com munities
|
||||||
|
Document ID: 59_280_110805 am4srrc amp word template v10.4 |
|||||||
|
Rev No |
Date |
Revision Details |
Author |
Reviewer |
Approver |
||
|
R1 |
November 2012 |
1st Draft |
BP |
SM |
|
||
|
R2 |
December 2012 |
2nd Draft |
BP |
SM |
|
||
|
R3 |
January 2013 |
3rd Draft |
BP |
NW |
|
||
|
R4 |
January 2013 |
4th Draft |
BP |
|
|
||
|
|
|
|
|
|
|
||
|
Attachment a.: Fleet Asset Management Plan 2013 |
TABLE OF CONTENTS
· 1............................................................................................................. EXECUTIVE SUMMARY
· 2...................................................................................................................... INTRODUCTION
· 2.1 Background
· 2.2 Goals and Objectives of Asset Management
· 2.3 Plan Framework
· 2.4 Core and Advanced Asset Management
· 3................................................................................................................. LEVELS OF SERVICE
· 3.1 Community Engagement
· 3.2 Legislative Requirements
· 3.3 Current Levels of Service
· 3.4 Desired Levels of Service
· 4................................................................................................................... FUTURE DEMAND
· 4.1 Demand Forecast
· 4.2 Changes in Technology
· 4.3 Demand Management Plan
· 5.............................................................................................. LIFECYCLE MANAGEMENT PLAN
· 5.1 Background Data
· 5.2 Risk Management Plan
· 5.3 Routine Maintenance Plan
· 5.4 Renewal/Replacement Plan
· 5.5 Creation/Acquisition/Upgrade Plan
· 5.6 Disposal Plan
· 6............................................................................................................ FINANCIAL SUMMARY
· 6.1 Financial Statements and Projections
· 6.2 Funding Strategy
· 6.3 Valuation Forecasts
· 7............................................................................................ ASSET MANAGEMENT PRACTICES
· 7.1 Accounting/Financial Systems
· 7.2 Asset Management Systems
· 7.3 Information Flow Requirements and Processes
· 7.4 Standards and Guidelines
· 8................................................................................ PLAN IMPROVEMENT AND MONITORING
· 8.1 Performance Measures
· 8.2 Improvement Plan
· 8.3 Monitoring and Review Procedures
· REFERENCES
· Appendix A Maintenance Response Levels of Service
· Appendix B Projected 10 year Capital Renewal Works Program
· Appendix C Planned Upgrade/Exp/New 10 year Capital Works Program
· Appendix D Core Risk Register
· Appendix E Abbreviations
· Appendix F Glossary
This page is left intentionally blank.
 Context
The Shire of Esperance is located on Western Australia’s southeast coast approximately 700 km’s from Perth by road. The Shire has an area of 44,336 square kilometres and extends from Munglinup Beach in the west to Israelite Bay in the east and incorporates Salmon Gums in the north. Esperance is predominately a cropping / grazing agricultural area with a Port that actively services regional agricultural and mining industries. It is anticipated that the Shire’s inclusion as a Supertown will lead to significant opportunities for development however the projected growth is yet to be determined and has not been factored into this plan.
Purpose & Scope
The Shire owns and operates a fleet of plant and equipment that enables it to provide services required by the community. Organisational mobility is essential for moving people, materials and tools to works sites. A lack of mobility may result in lower productivity and interruption to services.
Effective Fleet management includes programs to preserve the value of equipment, measuring and minimising un-scheduled servicing, collecting, analysing and reporting data that enables informed asset management decision to be made.
The Asset Management Plan provides details to support a long-term financial plan for fleet over a 10 year period.
Fleet assets represent a significant investment for the organisation and in 2012 comprises of 171 assets:
· Current replacement cost $12,443,270
· Depreciated replacement cost $6,655,972
· Annual depreciation expense $1,263,142
What does it Cost?
The lifecycle plan for fleet assets is about:[1]
· Purchasing assets subject to a business case using whole-of-life costs and utilisation rates.
· Operating assets in a manner they were designed for.
· Maintaining assets in line with manufacturer’s requirements.
· Replacing assets in accordance with optimum replacement principles.
· Disposing of assets in accordance with utilisation and other benchmarks.
· Funding the 10 year replacement program using a reserve developed from internal hire rates. (SOE have not adopted this process)
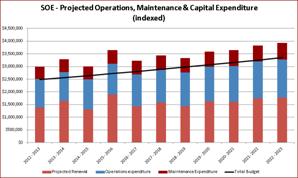
The projected cost to provide the services covered by this Asset Management Plan includes operations, maintenance, renewal and upgrade of existing assets over the 10 year planning period.
What we can do
Provide Fleet infrastructure by:
· Determining agreed service levels and funding strategies over the 10 year planning period.
· Meeting agreed funding levels for operation, maintenance, renewal and upgrade.
· Manage Fleet assets using best practice utilisation and optimisation strategies.
· Undertake regular reviews of asset valuations, residuals and renewal programs.
What we cannot do
· Manage existing, new or upgraded asset requirements without addressing funding gaps.
The Next Steps
Actions resulting from this AMP include:
· Implement a data maintenance process
· Review risk register and treatment plans
· Review workshop staffing levels
· Implement dedicated Fleet Management System
· Review workshop facilities
· Further develop or review Levels of Service
· Document operation and maintenance guidelines
· Further develop financial tracking & reporting
· Integrate Fleet systems with finance for Fair value accounting and Long Term Financial Plan
What is an Asset Management Plan?
Asset management planning is a comprehensive process to ensure delivery of services from infrastructure is provided in a financially sustainable manner.
The asset management plan details information about infrastructure assets including actions required to provide an agreed level of service in the most cost effective manner. The Plan defines the services to be provided, how the services are provided and what funds are required to provide the services.
Is there a funding shortfall?
The completion of renewal and asset management plans will provide Council with the opportunity to
What happens if we don’t manage the shortfall?
It is possible that Council will have to reduce service levels in some areas, unless new sources of revenue are found or reallocated.
What can we do?
Council can develop options and priorities to ensure that Fleet services are managed sustainably and consult with the community to plan future services to match the community services needs with ability to pay for services and maximise benefit to the community for costs to the community.
Identify and address fleet and plant funding requirements over the 10 year planning period.
What options do we have?
Resolving the funding shortfall involves several steps:
1. Improving asset knowledge so that data accurately records the asset inventory, how assets are performing and when assets are not able to provide the required service levels,
2. Improving our efficiency in operating, maintaining, replacing existing and purchasing new assets to optimise life cycle costs,
3. Identifying and managing risks associated with providing services from infrastructure.
4. Making tradeoffs between service levels and costs to ensure that the community receives the best return from infrastructure through adequate resourcing of assets.
5. Indentifying assets surplus to needs for disposal to make saving in future operations and maintenance costs.
6. Consulting with the community to ensure that services and costs meet community needs and are affordable,
7. Developing partnership with other bodies, where available to provide services;
8. Seeking additional funding from governments and other bodies to better reflect a ‘whole of government’ funding approach to infrastructure services.
Key assumptions have been used in the preparation of this AMP, these are presented to enable readers to gain an understanding of the levels of confidence in the data behind the financial forecasts.
|
Condition |
||||||
|
The condition grade of individual assets has not been assessed. |
||||||
|
It is assumed through the use of optimisation strategies and the current maintenance regime that all Passenger & Heavy Plant are Condition 3 at the designated point of disposal. Some items of minor plant may however be retained for the balance of their entire service life and their condition may predictably deteriorate up to that point. It is acknowledged that operator training and operating environment may impact asset condition and residual values. |
||||||
|
Financials |
||||||
|
Maintenance expenditure categories and data is drawn directly from Authority and averaged over 3 years |
||||||
|
Expenditure excludes Homecare, Wylie Bay Landfill and Airport specific assets |
||||||
|
Operations |
$1,110,359 |
|||||
|
Planned |
$355,035 |
|||||
|
Reactive |
$131,541 |
|||||
|
Total |
$1,575,342 |
|||||
|
Renewal data below from MARS responsible officers report (purchase - disposal = renewal) |
||||||
|
· Net Capital exp. |
· Light |
· Heavy |
· Misc. |
· Total |
||
|
2011-12 |
$173,344 |
$441,100 |
$80,415 |
$694,859 |
||
|
2010-11 |
$211,372 |
$635,189 |
$137,070 |
$983,631 |
||
|
2009-10 |
$181,877 |
$778,716 |
$42,200 |
$1,002,793 |
||
|
Total |
|
|
$2,681,283 |
|||
|
Average |
$188,864 |
$618,335 |
$86,562 |
$893,761 |
||
|
Asset Data |
||||||
|
Data sources: |
2012-13 10 Year Heavy Plant Replacement Program |
|||||
|
2012-13 10 Year Light Vehicle Replacement Program |
||||||
|
MARS - additional assets not included in Heavy/Light Program |
||||||
|
Authority - Plant Enquiry by "Active" Status |
||||||
|
Excludes - HACC - Assets are either self funded or funded through external sources |
||||||
|
Excludes - Fire, Emergency and SES fleet - funded through the respective organisations |
||||||
|
Excludes - Airport Fleet - separately funded and covered by Airport AMP |
||||||
|
Excludes – Wylie Bay Landfill Fleet - separately funded, to be included under separate AMP |
||||||
|
Assets included in this register are limited by the Shire’s adopted materiality value of $5,000 |
||||||
|
Year acquired |
||||||
|
Based on actual date acquired where available |
||||||
|
Otherwise based on Authority date of acquisition or date entered into system |
||||||
|
Adjustments made based on knowledge i.e. assets acquired second hand or pre-dating existing records |
||||||
|
Values |
||||||
|
Values based on 10 Year Light and Heavy Replacement Program |
||||||
|
Additional detail confirmed in Authority, Trim and invoice as required |
||||||
|
Annual depreciation cost = CRC / useful life |
||||||
|
Depreciated replacement cost = CRC - age x annual depreciation cost |
||||||
|
Current replacement cost derived from current market values with CPI adjustments as required |
||||||
|
Residual value calculated using historic sales data, Redbook and CPI adjustments |
||||||
|
Useful Life |
|
|
Useful Life used in the 10 Year light and Heavy Replacement Programs was determined using information provided in the Uniqco Light Fleet review 2009 and IPWEA Plant & Vehicle management Manuals |
|
|
Methodology |
|
|
Processes have been developed to comply with the Local Government Act 1995 and Local Government Regulations 1996 |
|
|
The WALGA Procurement Handbook (current edition) is the guiding document in all supply and tendering processes. |
|
|
Heavy |
Managed using WALGA preferred suppliers and System.plus assessment tools |
|
Misc. |
Managed using local suppliers and System.plus evaluation criteria |
|
Light |
Managed using local suppliers and System.plus evaluation criteria |
|
Systems.plus |
IPWEA Fleet Management subscription service incorporates utilisation, whole of life and optimisation |
|
The following criteria have been applied or considered by the “Manager of Engineering Assets” in the determination of the replacement schedule and values used in this plan. The methodology is detailed and reference to the “IPWEA Plant and Vehicle Management Manual 3rd Edition” should be made for further information. |
|
|
Whole of life costs |
Projection of future costs using first principles. |
|
Utilisation |
A unit of work measure for comparison or benchmarking. |
|
Optimisation |
Predicting resale value and costs to maximise the return on investment |
|
Down time |
The time that an asset is unavailable for its normal use due to servicing or maintenance. |
|
Maintenance failure |
Any servicing or maintenance activity that is not part of regular or planned activities. |
|
Purchasing Policy |
Policy outlines purchasing and disposal criteria. |
|
Maintenance & Servicing |
|
|
Based on Manufacturers recommended intervals |
|
|
Scheduled maintenance and servicing conducted by qualified staff or external agent as required |
|
|
Un-scheduled as per Scheduled |
|
|
Classifications |
|
|
Light |
Staff and light operational vehicles |
|
Misc. |
mowers, trailers, caravans, mixed plant |
|
Heavy |
graders, loaders, trucks, rollers, road plant |
2. INTRODUCTION
2.1 Background
This asset management plan is to demonstrate responsive management of assets (and services provided from assets), compliance with regulatory requirements, and to communicate funding needed to provide the required levels of service.
The asset management plan is to be read with the following associated planning documents:
· Shire of Esperance Strategic Action Plan 2007 – 2027
· Motor Vehicles Policy (HR 001 September 2007)
· Light Vehicle Purchasing (MP-3-008)
· Staff Entitlements Policy (HR 002 July 2010)
· Staff use of Shire Equipment for Private Purposes Policy (Exec 009 September 2007)
· Financial Management Policy (Corp 002 September 2007)
· Council Budget (Current Year)
· Shire of Esperance Plan for the Future 2010/11 to 2012/13
· Records Management Policy (Corp 009 July 2010)
· Light Fleet Review (Uniqco November 2009)
· 2012-13 10 Year Heavy Plant Replacement Program
· 2012-13 10 Year Light Vehicle Replacement Program
· WALGA Fleet Safety Resource Kit
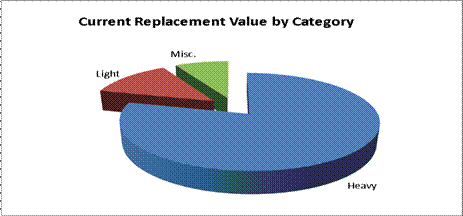
Table 2.1: Assets covered by this Plan
|
Asset category |
Dimension |
Quantity |
Current replacement cost |
Depreciated replacement cost |
Annual depreciation cost |
|
Heavy |
Includes graders, loaders, trucks, rollers, road plant etc |
69 |
$9,827,220 |
$5,134,788 |
$973,542 |
|
Light |
Staff and light operational vehicles |
41 |
$1,600,200 |
$1,103,067 |
$228,975 |
|
Misc. |
Includes mowers, trailers, caravans, mixed plant etc |
44 |
$1,015,850 |
$418,118 |
$60,625 |
|
TOTAL |
|
154 |
$12,443,270 |
$6,655,972 |
$1,263,142 |
·
·
·
·
·
·
·
·
·
·
·
·
2.2 Goals and Objectives of Asset Management
The Council exists to provide services to its community. The Shire of Esperance owns and operates a fleet of plant and equipment to assist in providing these services. Management of the fleet is therefore critical in ensuring community, strategic and operational service levels are achieved now and in the future.
The key elements of Fleet asset management are:
· Taking a life cycle approach,
· Developing cost-effective management strategies for the long term
· Providing a defined level of service and monitoring performance
· Understanding and meeting the demands of growth
· Managing risks
· Continuous improvement in asset management practices.[2]
The goal of this asset management plan is to:
· Document fleet management processes
· Document the services/service levels to be provided and their costs
· Provide information to support decisions regarding service levels, costs and risks in a financially sustainable manner.
This asset management plan is prepared under the direction of Council’s vision, mission, goals and objectives.
Council’s vision is:
The spirit of Esperance is unique; we take pride in being a creative, caring and supportive community. We live in a diverse and dynamic region with outstanding opportunities for all. As custodians, we are committed to protect our spectacular natural environment. Esperance has a sense of community ownership with a commitment to determine its own direction. “We make it happen”.
Council’s mission is:
The Shire of Esperance will listen to its people and provide services in a caring, responsive and consultative manner through Councillors and staff that are well equipped to meet community needs, and show leadership in development at regional and higher levels.
Organisation Goals and how these are addressed in this Plan:
· Organisational Goals, Strategies and Outcomes have been developed in the “Strategic Community Plan 2012-2022”. This has been developed under the Integrated Planning and Reporting Framework legislated in 2011.
·
· The Strategic Community Plan is an overarching plan that will guide the future direction of Council’s policies, plans, projects and decision making over the 10 year period to 2022. The Strategic Community Plan is structured around 4 themes. Each theme has associated goals, strategies and outcomes which success will be measured against. The measures will be outlined in the Corporate Business Plan currently under development.
·
·
·
·
2.3 Plan Framework
Key elements of the plan are
· Levels of service – specifies the services and levels of service to be provided by council.
· Future demand – how this will impact on future service delivery and how this is to be met.
· Life cycle management – how the organisation will manage its existing and future assets to provide the required services
· Financial summary – what funds are required to provide the services.
· Asset management practices
· Monitoring – how the plan will be monitored to ensure it is meeting the organisation’s objectives.
· Asset management improvement plan
2.4 Core and Advanced Asset Management
This asset management plan is prepared as a first cut ‘core’ asset management plan in accordance with the International Infrastructure Management Manual. It is prepared to meet minimum legislative and organisational requirements for sustainable service delivery and long term financial planning and reporting. Core asset management is a ‘top down’ approach where analysis is applied at the ‘system’ or ‘network’ level.
·
3. LEVELS OF SERVICE
3.1 Community Engagement
It is intended that future revisions of the asset management plan will incorporate community engagement on service levels and costs of providing the service. This will assist Council and the community in matching the level of service needed by the community, service risks and consequences with the community’s ability to pay for the service.
3.2 Legislative Requirements
Council has to meet many legislative requirements including Australian and State legislation and State regulations. Relevant legislation is shown in Table 3.2.
Table 3.2: Legislative Requirements
|
Legislation |
Requirement |
|
· Local Government Act |
· Sets out role, purpose, responsibilities and powers of local governments including the preparation of a long term financial plan supported by asset management plans for sustainable service delivery. · |
|
· Disability Services Act (1993) |
· An Act for the establishment of the Disability Services Commission and the Ministerial Advisory Council on Disability, for the furtherance of principles applicable to people with disabilities, for the funding and provision of services to such people that meet certain objectives, for the resolution of complaints by such people, and for related purposes · |
|
· OSH Act 1984 |
· The guidelines for employees and employers to undertake within the work environment · |
|
· OSH Regulations 1996 |
· The guidelines for employees and employers to undertake within the work environment · |
|
· Motor Vehicle Standards Act 1989 (Australian Design Rules) |
· The Australian Design Rules (ADRs) are national standards for vehicle safety, anti-theft and emissions |
3.3 Current Levels of Service
Council is defining service levels in two terms.
Community Levels of Service relate to the service outcomes that are expected by the community and may include safety, quality, quantity, reliability, responsiveness and cost effectiveness.
Technical Levels of Service - Supporting the community service levels are operational or technical measures of performance. These may relate to utilisation, sustainability, maintenance and renewal..
Council’s current service levels are detailed in Table 3.3.
Table 3.3: Current Service Levels
|
Level of Service |
Objective |
Performance Measure |
Desired Level of Service |
Current Level of Service |
|
COMMUNITY LEVELS OF SERVICE |
||||
|
Function |
Provide sufficient fleet assets to meet the communities desired levels of service |
- SOE policies - Best practice principles |
Fleet assets are managed using adopted policies and best practice standards |
Currently utilising some best practice principles, fleet management system to be implemented 2013 |
|
Performance |
Provide a fleet is functional and operational |
- Maintenance failures - Labour rates - Scheduled / un-scheduled maintenance ratio |
Measure and benchmark with national averages |
Not currently measured |
|
Safety |
Ensure assets are operated, maintained, serviced and repaired to industry standards |
Accidents / injuries / near miss statistics |
0 preventable injuries per annum |
Not currently measured |
|
TECHNICAL LEVELS OF SERVICE |
||||
|
Sustainability |
Minimise whole of life costs |
- Fixed / variable costs - Internal Hire rates - Depreciation |
Costs minimised and benchmarked with national averages |
Currently not measured, incorporate with systems package |
|
Utilisation |
Maximise utilisation rates |
- Distance travelled - Plant hours - Service intervals - Optimised renewal
|
Utilisation maximised and benchmarked with national averages
|
Currently addressed through existing 10 Year Plans |
|
Renewal |
Renewal completed on-time and within budget |
Renewals in accordance with Vehicle Replacement Plans
|
Renewal within annual budgets |
Residual values under review due to market fluctuations |
3.4 Desired Levels of Service
Desired level of service will be determined using various sources including residents, feedback to Councillors and staff, service requests and correspondence. Council has yet to quantify all current levels of service. This will be done in future revisions of this asset management plan and incorporate performance measures obtained from the proposed Fleet Management System.
4. FUTURE DEMAND
4.1 Demand Forecast
Demand may affected by a population growth, seasonal use of the Shire’s road network and by factors including availability of resources such as gravel. This in turn may affect haul distances, types of plant required, plant renewal frequency and budgets. The Shires ability to meet any future desired level of service from Fleet infrastructure will be managed through successive reviews of the asset management plan.
It is envisaged that the community’s expectation of service will be met by the Shire’s current and proposed fleet management plans.
4.2 Changes in Technology
Changes in technology may result from variations to manufacturer’s vehicle specifications, performance and/or safety ratings but are not forecast to have significant impact on the delivery of services covered by this plan.
4.3 Demand Management Plan
New services are managed through a combination of managing existing assets, upgrading of existing assets and providing new assets to meet demand. Demand management practices may include non-asset solutions, insuring against risks and managing failures.
Non-asset solutions focus on providing the required service without the need for council to own the assets. Examples of non-asset solutions may include the sharing of assets and resources with neighbouring or other organisations.
There are no current agreements with regard to resource sharing.
There are no new donated assets identified in this plan.
Acquiring these new assets will commit council to fund ongoing operations and maintenance costs for the period that the service provided from the assets is required. These future costs are identified and considered in developing forecasts of future operations and maintenance costs.
5. LIFECYCLE MANAGEMENT PLAN
The lifecycle management plan outlines how Council plans to manage and operate the assets at the agreed levels of service (defined in Section 3) while optimising life cycle costs.
5.1 Background Data
5.1.1 Physical parameters
The assets covered by this asset management plan are shown in Table 2.1.
Assets, including many major plant items operating outside the Esperance townsite, may remain in the field for extended periods. Fleet assets not approved for private use are returned and secured within one of the Shire depots daily. Employees may be approved under Shire Policy HR001 for private use of Light operational vehicles.
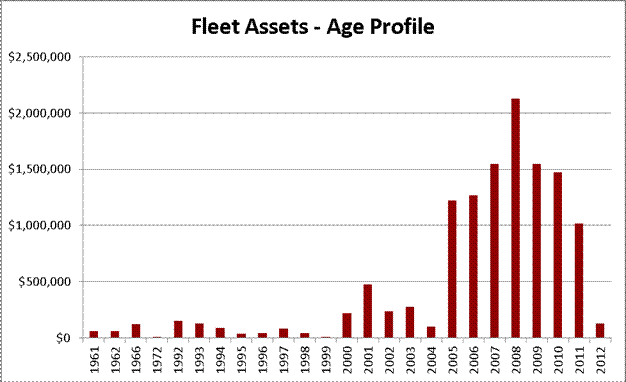
The age profile of the assets include in this AM Plan is shown in Figure 2.
Figure 2: Asset Age Profile
5.1.2 Asset capacity and performance
Known service performance deficiencies are detailed in Table 5.1.2 below.
Table 5.1.2: Known Service Performance Deficiencies
|
Area |
Service Deficiency |
|
Fleet maintenance facilities |
Review workshop facilities and capacity to meet current and future fleet maintenance requirements
|
|
Fleet maintenance staff |
Review of workshop staffing to support current and future maintenance schedules
|
|
Fleet Management Systems |
Implement a dedicated Fleet Management System to ensure best management practices and future planning and reporting capability
|
This plan assumes that all assets are to be renewed. Future reviews of this plan may include rationalisation of assets.
5.1.3 Asset condition
Condition is measured using a 1 – 5 rating system as detailed in Table 5.1.3.
Table 5.1.3: IIMM Description of Condition
|
Rating |
Status |
Definition |
|
· 1 |
· Very Good |
· Asset are in very good condition, no visible signs of wear, appears new or recently renovated, scheduled maintenance only, low or no risk |
|
· 2 |
· Good |
· Asset is in good condition, little wear, no longer new, scheduled maintenance only, low or no risk |
|
· 3 |
· Fair |
· Asset is in average condition, visible signs of wear, asset is functional, scheduled maintenance, possible un-scheduled maintenance, low risk |
|
· 4 |
· Poor |
· Asset is in poor condition, higher levels of wear, possible defects, scheduled maintenance, regular un-scheduled maintenance, higher risk |
|
· 5 |
· Very Poor |
· Asset is in very poor condition, has visibly failed, may not be operational, may be un-serviceable, may represent a high risk, immediate attention required |
The condition grade of individual fleet assets has not been assessed.
It is assumed through the use of optimisation strategies that all Light and Heavy plant are Condition 3 at the designated point of disposal. Some items of Misc. plant may be retained for the balance of their practical service life and their condition may predictably deteriorate up to that point.
5.1.4 Asset valuations
The value of assets recorded in the asset register as at 22/10/2012 covered by this asset management plan is shown below.
Current Replacement Cost $12,443.270 (Current replacement cost of all assets)
Depreciable Amount $ 8,884,399 (Current replacement cost – Residual)
Depreciated Replacement Cost $ 6,655,972 (CRC – accumulated depreciation)
Annual Depreciation Expense $ 1,263,142 (CRC – Residual / Useful Life)
Council’s sustainability reporting compares the rate of annual asset consumption to asset renewal and upgrade.
Asset Consumption Ratio 53.5% (Depreciated Replacement/Current Replacement)
A Department of Local Government measure with a target of between 50 and 75%. A ratio less than 50% indicates a rapid deterioration of assets, greater than 75% may indicate an over investment in the asset base.
Asset Sustainability Ratio 70.7% (Renewal expenditure/Depreciation exp)
A Department of Local Government measure with a target of between 90 and 110%. A ratio less than 90% may indicate under investment in renewal, greater than 110% may indicate over investment in renewal.
Asset Renewal Funding Ratio 65.0% (NPV planned renewal over 10 yrs/NPV required renewal 10 yrs)
A Department of Local Government measure with a target of between 95 and 105%. The ratio indicates that the Long Term Financial Plan makes adequate provision to maintain existing levels of service and renew or replace assets.
To provide services in a financially sustainable manner, Council will need to ensure that it is renewing assets at the rate they are being consumed over the medium-long term and funding the life cycle costs for all new assets and services in its long term financial plan.
5.1.5 Asset hierarchy
An asset hierarchy provides a framework for structuring data in an information system to assist in collection of data, reporting information and making decisions. The hierarchy includes the asset class and component used for asset planning and financial reporting and service level hierarchy used for service planning and delivery.
Council’s service hierarchy is shown is Table 5.1.5.
Table 5.1.5: Asset Service Hierarchy
|
Service Hierarchy |
Service Level Objective |
|
Heavy |
Provide and maintain fleet assets which enable major operational and construction tasks to be completed. Assets comply with all relevant standards and specifications.
|
|
Light |
Provide and maintain passenger and light operational vehicles to manufacturer’s specifications so as to ensure the safety of staff and public. Ensure the maximum utilisation and lowest whole of life costs while minimising environmental impacts. Assets comply with all relevant standards and specifications.
|
|
Misc. |
Provide and maintain minor fleet assets to enable operational tasks to be completed in a safe manner. Assets comply with all relevant standards and specifications.
|
5.2 Risk Management Plan
An assessment of risks associated with service delivery from infrastructure assets has identified critical risks that will result in loss or reduction in service from infrastructure assets or a ‘financial shock’ to the organisation. The risk assessment process identifies credible risks, the likelihood of the risk event occurring, the consequences should the event occur, develops a risk rating, evaluates the risk and develops a risk treatment plan for non-acceptable risks.
Critical risks, being those assessed as ‘Very High’ - requiring immediate corrective action and ‘High’ – requiring prioritised corrective action identified in the Infrastructure Risk Management Plan are summarised in Table 5.2.
Table 5.2: Critical Risks and Treatment Plans
|
Risk category |
What can Happen |
Risk Rating (VH, H) |
Risk Treatment Plan |
|
Operational |
Loss of productivity due to mechanical failure
|
H |
Scheduled maintenance and servicing to manufacturers specifications. Operator training |
|
Legal |
Physical injury to staff or public from at fault incident
|
H |
Operator training and insurances |
|
Maintenance risk |
Physical injury to staff or public due to mechanical failure
|
H |
Scheduled maintenance and insurances |
5.3 Routine Maintenance Plan
Routine maintenance is the regular on-going work that is necessary to keep assets operating, including instances where portions of the asset fail and need immediate repair to make the asset operational again.
5.3.1 Maintenance plan
Maintenance includes scheduled and un-scheduled work activities.
Un-scheduled maintenance is repair work carried out in response to service requests and management/supervisory directions.
Scheduled maintenance is regular servicing and repair work that is managed through Authority.
Maintenance activities include inspection, assessing the condition against failure/breakdown experience, prioritising, scheduling, actioning the work and reporting what was done to develop a maintenance history and improve maintenance and service delivery performance.
Actual past maintenance expenditure is shown in Table 5.3.1.
Table 5.3.1: Maintenance Expenditure Trends
|
Category |
2010 |
2011 |
2012 |
|
Fuels & Oils |
$824,121 |
$877,094 |
$919,104 |
|
Ground Engaging Tools |
$26,955 |
$27,334 |
$30,319 |
|
Insurances |
$68,451 |
$66,600 |
$71,383 |
|
Lease Payments |
$42,359 |
$19,709 |
$14,035 |
|
Parts & Repairs Scheduled Maintenance |
$297,974 |
$298,947 |
$133,595 |
|
Parts & Repairs Unscheduled Maintenance |
|
$3,736 |
$275,369 |
|
Registrations |
$17,766 |
$18,295 |
$18,722 |
|
Scheduled Maintenance Labour |
|
$1,206 |
$36,242 |
|
Tyres, Tubes etc |
$100,221 |
$87,970 |
$108,949 |
|
Unscheduled Maintenance Labour |
|
$1,642 |
$29,269 |
|
Workshop labour |
$146,848 |
$162,048 |
$64,542 |
|
Grand Total |
$1,524,694 |
$1,499,802 |
$1,701,530 |
Current maintenance expenditure levels reflect the actual costs to meet required service levels. Future revision of this asset management plan will include linking required maintenance expenditures with required service levels.
Assessment and prioritisation of reactive maintenance is undertaken by Management and operational staff.
5.3.2 Standards and specifications
Maintenance work is carried out in accordance with the following Standards and Specifications.
· Motor Vehicles Standards Act 1989
· Dept of Infrastructure and Transport - Australian Design Rules 3rd Edition
· Australian Dangerous Goods Code 7th Edition
· Road Traffic Act 1974
· Road Traffic (Vehicle Standards) Regulations 2002
· Road Traffic (Vehicle Standards) Rules 2002
· Road Traffic (Towed Agricultural Implements) Regulations 1995
· Vehicles – Information Bulletins (Safety and Standards) and Vehicle Standards Bulletins (VSB’s) published through the Department of Transport WA
· Manufacturers vehicle specifications
5.3.3 Summary of future operations and maintenance expenditures
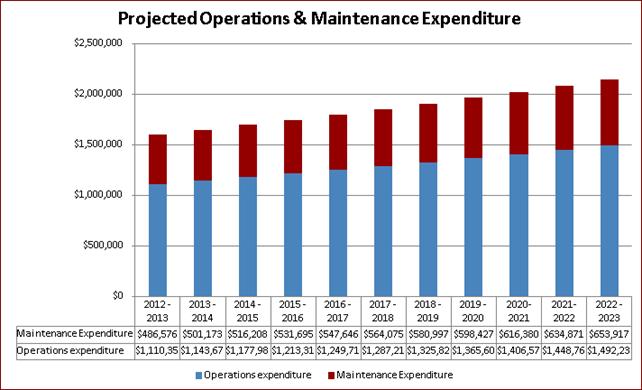
Future operations and maintenance expenditure requires review in line with desired levels of service. Planned maintenance schedules will be required and should trend in line with the value of the asset stock as shown in Figure 4. Note that all costs are shown in 2012/13 dollar values.
Figure 4: Projected Operations and Maintenance Expenditure
5.4 Renewal/Replacement Plan
Fleet renewal expenditure may include the major refurbishment of Heavy plant or the complete replacement of an existing asset in any category. Purchase or provision of fleet assets other than existing is considered new expenditure.
5.4.1 Renewal plan
Renewal planning for Fleet assets may involve calculating optimum replacement using various data including downtime, repair and maintenance costs, resale values, utilisation based on distance travelled or engine time.
Calculating the optimum replacement point will ensure maximum resale value, avoid increased maintenance and repair costs and in the long term reduce annual plant replacement costs.
Useful life, as calculated in the Light Fleet Review conducted by Uniqco have been used to determine the renewal dates used in this plan.
It is intended that future versions of this asset management plan will incorporate the benefits of a dedicated Fleet Asset Management System to ensure optimisation based on all relevant data.
5.4.2 Renewal standards
Renewal work is carried out as per 5.3.2 Maintenance standards.
5.4.3 Summary of projected renewal expenditure
Projected future renewal expenditures are forecast to increase over time as the asset stock ages. The costs are summarised in Figure 5. Note that all costs are indexed at the rate 0f 3%.
The projected capital renewal program is shown in Appendix B.
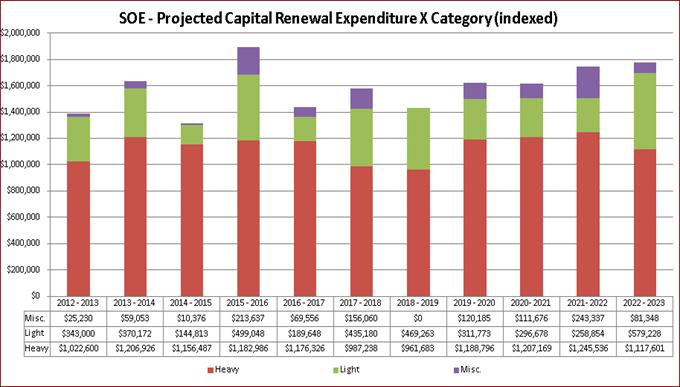 Figure 5: Projected Capital Renewal
Expenditure
Figure 5: Projected Capital Renewal
Expenditure
5.5 Creation/Acquisition/Upgrade Plan
There are no proposed new or upgraded assets currently approved by Council.
5.5.1 Selection criteria
The priority for and new or upgrade proposals will be based on a range of criteria which may vary depending on the nature, scale and location. A capital works evaluation method has not yet been adopted by the Shire and has been identified in the asset management improvement process.
5.5.2 Standards and specifications
Standards and specifications for new assets and for upgrade/expansion of existing assets are the same as those for renewal shown in Section 5.4.2.
5.5.3 Summary of projected upgrade/new assets expenditure
There are no projected upgrades or new assets included in this plan.
It is anticipated that future versions of this plan will include these projections.
5.6 Disposal Plan
This plan assumes that all assets are to be renewed. Disposal of Light and Heavy fleet assets typically involves trade-in at the time of asset replacement. Miscellaneous plant items may have little or no residual value or disposal costs. Disposal or non-renewal may be considered when identifying options for the management of assets in a later stage of planning and may include decommissioning, sale or relocation.
6. FINANCIAL SUMMARY
This section contains the financial requirements resulting from all the information presented in the previous sections of this asset management plan. The financial projections will be improved as further information becomes available on desired levels of service and current and projected future asset performance.
6.1 Financial Statements and Projections
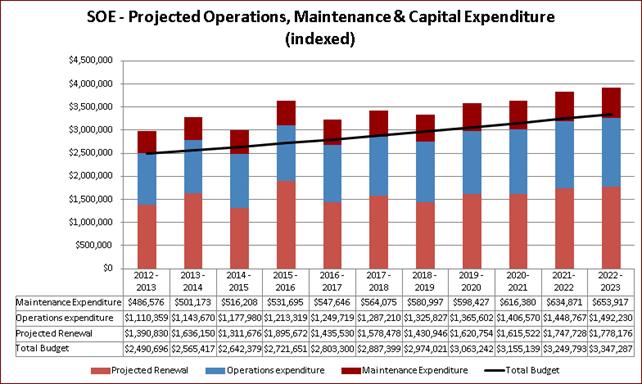
The financial projections are shown in Figure 7 for projected operations, total maintenance, projected capital expenditure and estimated budget funding. Note that all costs are indexed at the rate of 3%.
Figure 7: Projected Operating and Capital Expenditure and Budget
6.1.1 Financial sustainability in service delivery
The 10 Year plans for Light Vehicles and Heavy Plant have been developed using current standard utilisation and optimisation strategies. These have been combined with Miscellaneous plant to develop the 10 Year Fleet renewal program which incorporate life cycle costs and sustainability.
Life cycle costs (or whole of life costs) are the average costs that are required to sustain the service levels over the asset life. Life cycle costs include operations and maintenance expenditure.
Life cycle costs can be compared to life cycle expenditure to give an indicator of sustainability in service provision. Life cycle expenditure includes operations, maintenance and capital renewal expenditure in year 1. Life cycle expenditure will vary depending on the timing of asset renewals.
A shortfall between life cycle cost and life cycle expenditure is the life cycle gap.
Figure 8 shows the projected renewal from the Renewal Plan in Appendix B together with the budgeted renewal and resultant gap. This indicates that budgeted renewals are not geared to meet the projected renewals either on an annual or a cumulative basis.
Figure 8: Projected Fleet Renewal and Budget expenditure showing Renewal Gap
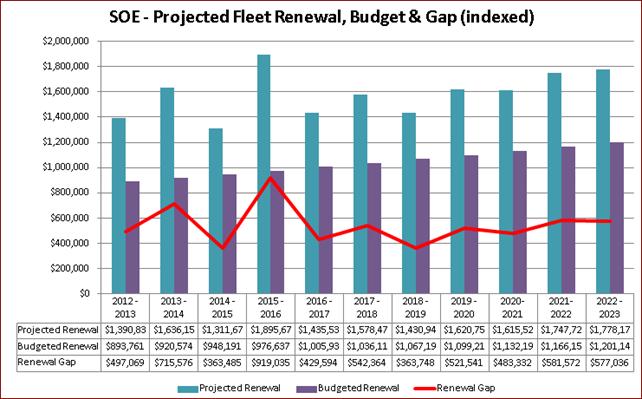
Figure 9 shows the projected renewal expenditure together with the average annual budget allocation for that asset category. This indicates that the renewal gap is generated primarily from the renewal of Heavy Plant
Figure 9: Projected Capital Expenditure & Budget by Fleet Category
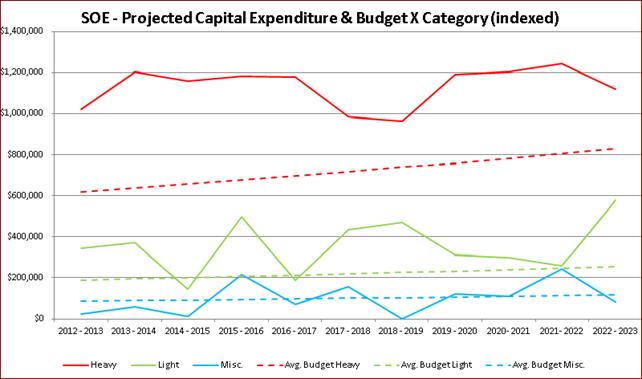
Table 6.1.1 shows the projected asset renewals in the 10 year planning period from Appendix B. The projected asset renewals are compared to budgeted renewal expenditure in the capital works program and capital renewal expenditure in year 1 of the planning period in Figure 8.
Table 6.1.1: Projected and Budgeted Renewals and Expenditure Shortfall
|
Year |
Projected Renewals ($000) |
Planned Renewal Budget ($000) |
Renewal Funding Shortfall ($000) (-ve Gap, +ve Surplus) |
Cumulative Shortfall ($000) (-ve Gap, +ve Surplus) |
|
2012 - 2013 |
$1,390,830 |
$893,761 |
-$497,069 |
-$497,069 |
|
2013 - 2014 |
$1,636,150 |
$920,574 |
-$715,576 |
-$1,212,646 |
|
2014 - 2015 |
$1,311,676 |
$948,191 |
-$363,485 |
-$1,576,131 |
|
2015 - 2016 |
$1,895,672 |
$976,637 |
-$919,035 |
-$2,495,166 |
|
2016 - 2017 |
$1,435,530 |
$1,005,936 |
-$429,594 |
-$2,924,760 |
|
2017 - 2018 |
$1,578,478 |
$1,036,114 |
-$542,364 |
-$3,467,125 |
|
2018 - 2019 |
$1,430,946 |
$1,067,197 |
-$363,748 |
-$3,830,873 |
|
2019 - 2020 |
$1,620,754 |
$1,099,213 |
-$521,541 |
-$4,352,413 |
|
2020- 2021 |
$1,615,522 |
$1,132,190 |
-$483,332 |
-$4,835,745 |
|
2021- 2022 |
$1,747,728 |
$1,166,155 |
-$581,572 |
-$5,417,318 |
|
2022 - 2023 |
$1,778,176 |
$1,201,140 |
-$577,036 |
-$5,994,354 |
Note: An negative shortfall indicates a funding gap, a positive shortfall indicates a surplus for that year.
Providing services in a sustainable manner will require matching of projected asset renewals to meet agreed service levels with planned capital works programs and available revenue.
A gap between projected asset renewals, planned asset renewals and funding indicates that further work is required to manage required service levels and funding to eliminate any funding gap.
We will manage the ‘gap’ by developing this asset management plan to provide guidance on future service levels and/or increasing resources available for the replacement of the fleet.
6.1.2 Expenditure projections for long term financial plan
Table 6.1.2 shows the projected expenditures for the 10 year long term financial plan.
Expenditure projections are indexed at the rate of 3%. No new assets have been identified in this asset management plan. No disposals have been identified in the asset management plan.
Table 6.1.2: Expenditure Projections for Long Term Financial Plan
|
Year |
Operations |
Maintenance |
Projected Capital Renewal |
|
2012 - 2013 |
$1,110,359 |
$486,576 |
$1,390,830 |
|
2013 - 2014 |
$1,143,670 |
$501,173 |
$1,636,150 |
|
2014 - 2015 |
$1,177,980 |
$516,208 |
$1,311,676 |
|
2015 - 2016 |
$1,213,319 |
$531,695 |
$1,895,672 |
|
2016 - 2017 |
$1,249,719 |
$547,646 |
$1,435,530 |
|
2017 - 2018 |
$1,287,210 |
$564,075 |
$1,578,478 |
|
2018 - 2019 |
$1,325,827 |
$580,997 |
$1,430,946 |
|
2019 - 2020 |
$1,365,602 |
$598,427 |
$1,620,754 |
|
2020- 2021 |
$1,406,570 |
$616,380 |
$1,615,522 |
|
2021- 2022 |
$1,448,767 |
$634,871 |
$1,747,728 |
Note: all figures have been indexed at the rate of 3% per annum.
6.2 Funding Strategy
Projected expenditure identified in Section 6.1 is to be funded from future operating and capital budgets.
6.3 Valuation Forecasts
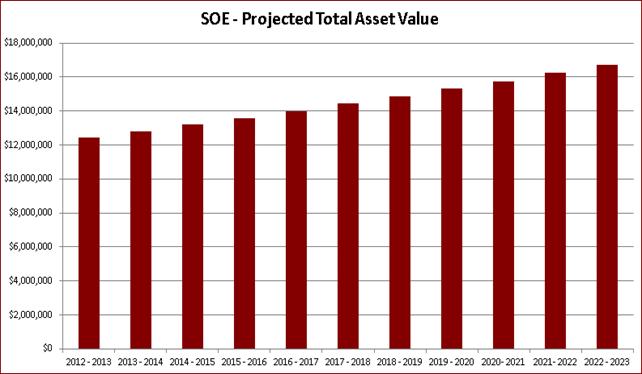
Asset values are not forecast to increase significantly as a result of additional or new assets.
Figure 9 shows the projected replacement cost asset values over the planning period. Values are indexed at the rate of 3%.
Figure 9: Projected Asset Values
·
The depreciated replacement cost (current replacement cost less accumulated depreciation) will vary over the forecast period depending on the rates of addition of new assets, disposal of old assets and consumption and renewal of existing assets. Forecast of the assets’ depreciated replacement cost have not been identified in the asset management plan.
7. ASSET MANAGEMENT PRACTICES
7.1 Accounting/Financial Systems
7.1.1 Accounting and financial systems
The current financial package provided by Civica is Authority.
The Shire undertook a major upgrade to Authority Version 6 in November 2011.
7.1.2 Accountabilities for financial systems
Accountability for the finance system resides in Corporate Services Directorate with the Manager of Financial Services having prime responsibility for system maintenance and development
7.1.3 Accounting standards and regulations
All local governments in Western Australia are required to prepare financial statements in accordance with the Local Government Act 1995, Local Government (Financial Management) Regulations 1996 and applicable Australian Accounting Standards (as they apply to local governments and not-for-profit entities).
7.1.4 Capital/maintenance threshold
Council has adopted a capitalisation materiality level of $5,000 for all asset classes. (Resolution S0308-1269)
The majority of assets in this asset class are above this threshold. Items below this limit include hand tools, power tools, gardening equipment and trailers.
7.1.5 Required changes to accounting financial systems arising from this AM Plan
There are no proposed changes to the accounting/financial systems resulting from this asset management plan however improvement opportunities are being identified and included in the Shires Asset Management Improvement Plan and will be the subject of future asset management plan revisions. The likely necessity to restructure the existing general ledger/chart of accounts to facilitate improved asset management reporting has been identified
7.2 Asset Management Systems
7.2.1 Asset management system
The Shire of Esperance has adopted the NAMS.Plus format for Asset Management and has undertaken the relevant training modules as a base for managing infrastructure asset data and the production of Asset Management Plans. A review of Asset Management Information Systems is expected in 2012/13.
7.2.2 Asset registers
Asset data is currently managed in spreadsheets and displayed as required using a combination of spreadsheet, database or proprietary software. Information collected may vary according to asset class but will include Asset ID, Name, description, year acquired, condition and current replacement cost as a minimum.
7.2.3 Linkage from asset management to financial system
The financial systems are not intrinsically linked to the Asset Management data. It is anticipated that the asset registers as they are created and the resultant re-valuations will be incorporated into the financial accounting system once Fair Value Accounting has been adopted and implemented.
7.2.4 Accountabilities for asset management system and data
The Asset Management system and processes are managed through a Strategic Group within the Shire who give direction to Officers to ensure assets are audited, associated plans are developed and Asset Management processes are further developed and implemented
7.2.5 Required changes to asset management system arising from this AM Plan
As the Asset Management systems and processes are still being developed there are no direct changes resulting from the AMP.
7.3 Information Flow Requirements and Processes
The key information flows into this asset management plan are:
· Council strategic and operational plans,
· Service requests from the community,
· Network assets information,
· The unit rates for categories of work/materials,
· Current levels of service, expenditures, service deficiencies and service risks,
· Projections of various factors affecting future demand for services and new assets acquired by Council,
· Future capital works programs,
· Financial asset values.
The key information flows from this asset management plan are:
· The projected Works Program and trends,
· The resulting budget and long term financial plan expenditure projections,
· Financial sustainability indicators.
These will impact the Long Term Financial Plan, Strategic Longer-Term Plan, annual budget and departmental business plans and budgets.
7.4 Standards and Guidelines
Standards, guidelines and policy documents referenced in this asset management plan are:
· IPWEA “International Infrastructure Management Manual”
· Australian Standards
8. PLAN IMPROVEMENT AND MONITORING
8.1 Performance Measures
The effectiveness of the asset management plan can be measured in the following ways:
· The degree to which the required cashflows identified in this asset management plan are incorporated into the organisation’s long term financial plan and Community/Strategic Planning processes and documents,
· The degree to which 1-5 year detailed works programs, budgets, business plans and organisational structures take into account the ‘global’ works program trends provided by the asset management plan;
8.2 Improvement Plan
A separate “Asset Management Strategy 2012 to 2014” has been adopted by Council. This document details the status and goals for Asset Management and sets out an action plan to achieve them. This document is due for review in 2014.
The asset management improvements generated from this asset management plan is shown in Table 8.2.
Table 8.2: Improvement Plan
|
Task No |
Task |
Responsibility |
Timeline |
|
1 |
Review and Implement a process to ensure the Asset Database is maintained and accurate |
Engineering Services |
2012/13 |
|
2 |
Review risk register and implement treatment plans. |
Community Services |
2012/13 |
|
3 |
Review staffing levels within the workshop to support the fleet maintenance schedule |
Engineering Services |
2013/14 |
|
4 |
Review and implement a dedicated Fleet Management System to support best fleet management practices |
Engineering Services |
2013/14 |
|
5 |
Review workshop facilities required to provide current and future fleet maintenance requirements |
Engineering Services |
2013/14 |
|
6 |
Review desired levels of service and determine renewal priority or other options |
Corporate Services Engineering Services |
2013/14
|
|
7 |
Develop and implement operational and maintenance guidelines and link to service levels. |
Engineering Services |
2013/14 |
|
8 |
Further develop financial tracking of Maintenance and Renewal expenditure. |
Engineering Services Financial services |
2013/14
|
|
9 |
Review the integration of the fleet asset register with the financial systems for Long Term Planning |
Engineering Services Financial services |
2013/14
|
8.3 Monitoring and Review Procedures
This asset management plan will be reviewed during annual budget preparation and amended to recognise any material changes in service levels and/or resources available to provide those services as a result of the budget decision process.
A full review of this Asset Management Plan is expected within 5 years.
REFERENCES
IPWEA Plant and Vehicle Management Manual 3rd edition
International Infrastructure Management Manual – International Edition 2011
Shire of Esperance ‘Strategic Action Plan 2007 – 2027’
Shire of Esperance ‘Annual Plan and Budget’
Shire of Esperance ‘Plan for the Future 2010/11 to 2012/13’
Shire of Esperance ‘Asset Management Policy’
Shire of Esperance ‘Asset Management Strategy 2012 to 2014’
Shire of Esperance ‘Financial Management Policy 2007’
Shire of Esperance ‘Records Management Policy 2010’
Shire of Esperance ‘HR 001 – Motor Vehicles’
Shire of Esperance ‘MP-3-008 – Light Vehicle Purchasing’
Shire of Esperance ‘ECEC 009 – Staff use of Shire Equipment for Private Purposes’
DVC, 2006, Asset Investment Guidelines, Glossary, Department for Victorian Communities, Local Government Victoria, Melbourne, http://www.dpcd.vic.gov.au/localgovernment/publications-and-research/asset-management-and-financial.
IPWEA, 2006, International Infrastructure Management Manual, Institute of Public Works Engineering Australia, Sydney, www.ipwea.org.au.
IPWEA, 2008, NAMS.PLUS Asset Management Institute of Public Works Engineering Australia, Sydney, www.ipwea.org.au/namsplusError! Hyperlink reference not valid..
IPWEA, 2009, Australian Infrastructure Financial Management Guidelines, Institute of Public Works Engineering Australia, Sydney, www.ipwea.org.au/AIFMG.
IPWEA, 2011, Asset Management for Small, Rural or Remote Communities Practice Note, Institute of Public Works Engineering Australia, Sydney, www.ipwea.org.au/AM4SRRC.
Appendix A Maintenance Response Levels of Service
Response times for all assets under this AMP are prioritised relevant to the nature of any fault, the asset affected and services supplied. The safety and health of the community and staff are given the highest priority and maintenance tasks are undertaken accordingly.
|
Attachment a.: Fleet Asset Management Plan 2013 |
Appendix B Projected 10 year Capital Renewal Works Program
|
Estimated Net Capital Expenditure (Purchase - Residual, indexed to date of renewal) |
||||||||||||||
|
Category |
Alias |
Description |
Class |
2012 - 2013 |
2013 - 2014 |
2014 - 2015 |
2015 - 2016 |
2016 - 2017 |
2017 - 2018 |
2018 - 2019 |
2019 - 2020 |
2020- 2021 |
2021- 2022 |
2022 - 2023 |
|
Heavy |
C23 |
C23 Modern 2 Berth Caravan |
Caravan 2 Berth |
$6,720 |
||||||||||
|
Heavy |
C24 |
C24 Modern 2 Berth Caravan |
Caravan 2 Berth |
|||||||||||
|
Heavy |
C25 |
C25 Modern 2 Berth Caravan |
Caravan 2 Berth |
$5,150 |
||||||||||
|
Heavy |
C26 |
C26 Modern Caravan |
Caravan Ablution |
$6,149 |
||||||||||
|
Heavy |
C27 |
C27 - Modern Caravan |
Caravan 1 Berth / Ablut |
$6,334 |
||||||||||
|
Heavy |
C28 |
C28 Elross Twin Accommodation Caravan |
Caravan 2 Berth |
$5,305 |
||||||||||
|
Heavy |
C29 |
C29 Elross Ablution Caravan |
Caravan Ablution |
$6,524 |
||||||||||
|
Heavy |
C30 |
C30 2005 Single Berth Caravan |
Caravan 1 Berth |
$5,464 |
||||||||||
|
Heavy |
C31 |
C31 2006 Elross Caravan |
Caravan 1 Berth |
$5,628 |
||||||||||
|
Heavy |
C33 |
C33 Elross 2 Berth Caravan |
Caravan 2 Berth |
$5,796 |
||||||||||
|
Heavy |
C34 |
C34 Elross Recreation Caravan |
Caravan Recreation |
$5,970 |
||||||||||
|
Heavy |
D10 |
Bulldozer |
Bulldozer |
$330,393 |
||||||||||
|
Heavy |
FR8 |
Roller Vibrating |
Roller Vibrating |
$22,000 |
$27,057 |
|||||||||
|
Heavy |
G37 |
Grader - Grasspatch |
Grader |
$226,600 |
$278,689 |
|||||||||
|
Heavy |
G38 |
Grader - Central Maintenance |
Grader |
$233,398 |
$287,050 |
|||||||||
|
Heavy |
G39 |
Grader - Construction - Condingup |
Grader |
$240,400 |
$295,662 |
|||||||||
|
Heavy |
G40 |
Grader - Construction - Cascade |
Grader |
$247,612 |
$304,531 |
|||||||||
|
Heavy |
G41 |
Grader - Construction - Grasspatch |
Grader |
$255,040 |
||||||||||
|
Heavy |
G42 |
Grader - Construction - Cent. Maint. |
Grader |
$262,692 |
||||||||||
|
Heavy |
L45 |
Loader - Construction |
Loader |
$190,000 |
$220,262 |
|||||||||
|
Heavy |
L46 |
Backhoe - Town |
Backhoe |
$128,750 |
$153,734 |
|||||||||
|
Heavy |
L47 |
Backhoe - Grass Patch |
Backhoe |
$128,750 |
$153,734 |
|||||||||
|
Heavy |
L48 |
Backhoe - Condingup |
Backhoe |
$132,613 |
$158,346 |
|||||||||
|
Heavy |
L49 |
Skid Steer Loader - Town |
Loader Skid Steer |
$67,898 |
$78,712 |
|||||||||
|
Heavy |
L50 |
Backhoe - Cascade |
Backhoe |
$132,613 |
$163,097 |
|||||||||
|
Heavy |
L52 |
Skid Steer Loader - Patching |
Loader Skid Steer |
$54,636 |
$65,239 |
|||||||||
|
Heavy |
L54 |
Loader - Construction |
Loader |
$229,473 |
$274,002 |
|||||||||
|
Heavy |
L55 |
Loader - Town |
Loader |
$213,847 |
$255,344 |
|||||||||
|
Heavy |
LL5 |
Low Loader |
Loader Low |
$58,350 |
||||||||||
|
Heavy |
MR12 |
Roller Multiwheel |
Roller Multiwheel |
$118,450 |
$154,550 |
|||||||||
|
Heavy |
MR13 |
Roller Multiwheel |
Roller Multiwheel |
$118,450 |
||||||||||
|
Heavy |
MR14 |
Roller Multiwheel |
Roller Multiwheel |
$133,317 |
||||||||||
|
Heavy |
MR15 |
Roller Multiwheel |
Roller Multiwheel |
$115,000 |
$154,550 |
|||||||||
|
Heavy |
RB2 |
2nd Rockbuster |
Rockbuster |
$260,837 |
||||||||||
|
Heavy |
T100 |
Single Axle Tipper - Town |
Tipper Single Axle |
$98,345 |
$120,952 |
|||||||||
|
Heavy |
T101 |
Single Axle Tipper - Condinup |
Tipper Single Axle |
$104,335 |
||||||||||
|
Heavy |
T102 |
8 Wheel Tipper |
Tipper 8 Wheel |
$169,744 |
$191,048 |
|||||||||
|
Heavy |
T103 |
8 Wheel Tipper |
Tipper 8 Wheel |
$169,744 |
$191,048 |
|||||||||
|
Heavy |
T104 |
Prime Mover |
Truck Prime Mover |
$142,055 |
$159,884 |
|||||||||
|
Heavy |
T86 |
Single Axle Tipper |
Tipper Single Axle |
$67,643 |
||||||||||
|
Heavy |
T87 |
Single Axle Tipper |
Tipper Single Axle |
$67,643 |
||||||||||
|
Heavy |
T88 |
Single Axle Tipper |
Tipper Single Axle |
$90,000 |
$110,689 |
|||||||||
|
Heavy |
T89 |
Single Axle Tipper |
Tipper Single Axle |
$100,940 |
$120,528 |
|||||||||
|
Heavy |
T93 |
Single Axle Tipper Crew Cab |
Tipper Single Axle Crew Cab |
$56,650 |
$69,672 |
|||||||||
|
Heavy |
T94 |
8 Wheel Tipper |
Tipper 8 Wheel |
$174,836 |
$202,683 |
|||||||||
|
Heavy |
T95 |
Maintenance Truck |
Truck Maintenance |
$100,940 |
$127,868 |
|||||||||
|
Heavy |
T97 |
Prime Mover |
Truck Prime Mover |
$130,000 |
$146,316 |
$169,621 |
||||||||
|
Heavy |
T98 |
8 Wheel Tipper |
Tipper 8 Wheel |
$160,000 |
$180,081 |
$208,764 |
||||||||
|
Heavy |
T99 |
Single Axle Tipper - Cascade |
Tipper Single Axle |
$98,345 |
$120,952 |
|||||||||
|
Heavy |
TC25 |
Tractor RB |
Tractor |
$92,882 |
||||||||||
|
Heavy |
TC29 |
Tractor - Parks & Gardens |
Tractor |
$51,500 |
$63,339 |
|||||||||
|
Heavy |
TC30 |
Tractor - Rural Slasher |
Tractor |
$87,550 |
$101,494 |
|||||||||
|
Heavy |
TC32 |
Verge Mower |
Mower Verge |
$41,000 |
$44,802 |
$48,956 |
||||||||
|
Heavy |
TC33 |
Verge Mower |
Mower Verge |
$49,173 |
$55,344 |
|||||||||
|
Heavy |
TR59 |
TR59 03 Traffic Manag. Solar Power Lights Trailer |
Trailer Traffic Solar |
$21,000 |
||||||||||
|
Heavy |
TR60 |
TR60 03 Traffic Manag. Solar Power Lights Trailer |
Trailer Traffic Solar |
$21,000 |
||||||||||
|
Heavy |
TR73 |
Trailered Traffic Management Solar Powered Lights |
Trailer Traffic Solar |
$22,510 |
||||||||||
|
Heavy |
TR74 |
Trailered Traffic Management Solar Powered Lights |
Trailer Traffic Solar |
$22,510 |
||||||||||
|
Heavy |
TR77 |
Trailered Traffic Management Solar Powered Lights |
Trailer Traffic Solar |
$23,881 |
||||||||||
|
Heavy |
TR78 |
Trailered Traffic Management Solar Powered Lights |
Trailer Traffic Solar |
$23,881 |
||||||||||
|
Heavy |
TT4 |
End Tipper |
Tipper End |
$8,000 |
$122,987 |
|||||||||
|
Heavy |
TT5 |
End Tipper |
Tipper End |
$8,500 |
$119,405 |
|||||||||
|
Heavy |
VR11 |
Roller Vibrating |
Roller Vibrating |
$96,542 |
$115,276 |
|||||||||
|
Heavy |
VR12 |
Roller Vibrating |
Roller Vibrating |
$96,542 |
$115,276 |
|||||||||
|
Heavy |
WC2 |
Water Tanker |
Tanker Water |
$123,953 |
||||||||||
|
Heavy |
WT4 |
Water Tanker No. 4 |
Tanker Water |
|||||||||||
|
Heavy |
WT5 |
Water Tanker No. 5 |
Tanker Water |
|||||||||||
|
Heavy |
WT6 |
Water Tanker No. 6 |
Tanker Water |
$40,000 |
||||||||||
|
Heavy |
WT7 |
Water Tanker No. 7 |
Tanker Water |
|||||||||||
|
Light |
LV499 |
LV499 2007 Mitsubishi Triton D/C T/T DSL Man 4x4 |
LV Utility D/Cab Tray 4WD |
$32,782 |
$36,896 |
$40,317 |
||||||||
|
Light |
LV507 |
LV507 2007 Toyota Prado S/Wag DSL Man 4X4 |
LV S/Wagon 4WD |
$35,500 |
$41,154 |
$47,709 |
||||||||
|
Light |
LV516 |
LV516 2008 Mitsubishi Triton D/C T/T PET Man 2X4 |
LV Utility D/Cab Tray 2WD |
$20,000 |
$23,185 |
$26,878 |
||||||||
|
Light |
LV517 |
LV517 2008 Mitsubishi Triton D/C Well DSL Man 4X4 |
LV Utility D/Cab Well 4WD |
$30,000 |
$34,778 |
$40,317 |
||||||||
|
Light |
LV518 |
LV518 2008 Mitsubishi Triton D/C Well DSL Man 4X4 |
LV Utility D/Cab Well 4WD |
$33,765 |
$39,143 |
|||||||||
|
Light |
LV524 |
LV524 2008 Ford Mondeo TCDi Sdn DSL Auto 2X4 |
LV Sedan |
$37,000 |
$40,431 |
$45,505 |
||||||||
|
Light |
LV526 |
LV526 2008 Mitsubishi Triton S/C T/T DSL Man 2X4 |
LV Utility S/Cab Tray 2WD |
$20,600 |
$23,185 |
$26,878 |
||||||||
|
Light |
LV527 |
LV527 2008 Nissan Navara SP/C T/T DSL Man 4X4 |
LV SP/Cab Tray 4WD |
$24,000 |
$27,012 |
$30,402 |
||||||||
|
Light |
LV529 |
LV529 2008 Holden Colorado S/C T/T DSL Man 4x4 |
LV Utility S/Cab Tray 4WD |
$25,235 |
$29,254 |
|||||||||
|
Light |
LV530 |
LV530 2008 Toyota Hilux D/C T/T DSL Man 4X4 |
LV Utility D/Cab Tray 4WD |
$30,900 |
$35,822 |
|||||||||
|
Light |
LV531 |
LV531 2008 Toyota Hilux S/C T/T PET Man 2X4 |
LV Utility S/Cab Tray 2WD |
$20,600 |
$23,881 |
|||||||||
|
Light |
LV533 |
LV533 2008 Nissan Navara SP/C T/T DSL Man 4X4 |
LV Utility Sp/Cab Tray 4WD |
$24,720 |
$28,657 |
|||||||||
|
Light |
LV534 |
LV534 2008 Toyota Hilux D/C T/T PET Auto 2X4 |
LV Utility D/Cab Tray 2WD |
$20,600 |
$23,881 |
|||||||||
|
Light |
LV535 |
LV535 2008 Ford Falcon S/Wgn PET Auto 2X4 |
LV S/Wagon |
$35,535 |
$41,195 |
|||||||||
|
Light |
LV538 |
LV538 2009 Toyota Prado S/Wgn DSL Man 4X4 |
LV S/Wagon 4WD |
$39,542 |
$44,505 |
$50,090 |
||||||||
|
Light |
LV539 |
LV539 2010 Toyota Camry Altise Sdn PET AUTO 2X4 |
LV Sedan |
$24,720 |
$27,823 |
$31,315 |
||||||||
|
Light |
LV540 |
LV540 2009 Ford Ranger XL D/Cab Well DSL Man 4X4 |
LV Utility D/Cab Well 4WD |
$30,000 |
$32,782 |
$35,822 |
$40,317 |
|||||||
|
Light |
LV541 |
LV541 2010 Toyota Camry Altise Sdn PET Auto 2X4 |
LV Sedan |
$24,720 |
$27,012 |
$30,402 |
||||||||
|
Light |
LV542 |
LV542 2009 Ford Ranger XL D/C Well DSL Man 4X4 |
LV Utility D/Cab Well 4WD |
$26,000 |
$28,411 |
$31,045 |
$32,936 |
|||||||
|
Light |
LV543 |
LV543 2010 Toyota Camry Altise Sdn PET Auto 2X4 |
LV Sedan |
$24,720 |
$27,823 |
$31,315 |
||||||||
|
Light |
LV544 |
LV544 2010 Toyota Camry Altise Sdn PET Auto 2X4 |
LV Sedan |
$24,720 |
$27,823 |
|||||||||
|
Light |
LV545 |
LV545 2010 Holden Colorado D/C T/T Man DSL 4X4 |
LV Utility D/Cab Tray 4WD |
$26,780 |
$28,411 |
$30,141 |
$31,977 |
$33,924 |
||||||
|
Light |
LV547 |
LV547 2010 Holden Colorado D/C Well DSL Man 4X4 |
LV Utility D/Cab Well 4WD |
$31,827 |
$35,822 |
$40,317 |
||||||||
|
Light |
LV548 |
LV548 2010 Holden Colorado D/C Well DSL Man 4X4 |
LV Utility D/Cab Well 4WD |
$26,000 |
$28,411 |
$30,141 |
$34,942 |
|||||||
|
Light |
LV549 |
LV549 2010 Toyota Hilux S/C T/T DSL Man 4X4 |
LV Utility S/Cab Tray 4WD |
$25,992 |
$30,132 |
|||||||||
|
Light |
LV550 |
LV550 2010 Holden Colorado S/C T/T DSL Man 4X4 |
LV Utility S/Cab Tray 4WD |
$26,000 |
$27,583 |
$29,263 |
$31,045 |
$32,936 |
$34,942 |
|||||
|
Light |
LV551 |
LV551 2010 Mitsubishi Pajero S/W DSL Man 4X4 |
LV S/Wagon 4WD |
$35,500 |
$38,792 |
$41,154 |
$43,661 |
$47,709 |
||||||
|
Light |
LV552 |
LV552 2011 Subaru Forester S/Wagon PET Man AWD |
LV S/Wagon 4WD |
$26,881 |
$31,163 |
|||||||||
|
Light |
LV553 |
LV553 2011 Suzuki Grand Vitara S/W Pet Man 4X4 |
LV S/Wagon 4WD |
$26,881 |
$31,163 |
|||||||||
|
Light |
LV554 |
LV554 2011 Toyota Hilux D/C Well DSL Man 4X4 |
LV Utility D/Cab Well 4WD |
$26,000 |
$28,411 |
$30,141 |
$31,977 |
$33,924 |
||||||
|
Light |
LV555 |
LV555 2011 Nissan Navara S/C T/T DSL Man 4X4 |
LV Utility S/Cab Tray 4WD |
$26,772 |
$31,036 |
|||||||||
|
Light |
LV556 |
LV556 2010 Holden Colorado D/C T/T DSL Man 4X4 |
LV Utility D/Cab Tray 4WD |
$26,780 |
$28,411 |
$31,045 |
$32,936 |
|||||||
|
Light |
LV557 |
LV557 2011 Nissan Navara S/C T/T DSL Man 4X4 |
LV Utility S/Cab Tray 4WD |
$26,772 |
$30,132 |
|||||||||
|
Light |
LV558 |
LV558 2011 Holden Colorado LX D/C DSL T/T Man 4X4 |
LV Utility D/Cab Tray 4WD |
$31,827 |
$35,822 |
$40,317 |
||||||||
|
Light |
LV559 |
LV559 2011 Nissan Patrol ST Wagon DSL Man 4x4 |
LV S/Wagon 4WD |
$38,792 |
$42,389 |
$47,709 |
||||||||
|
Light |
LV560 |
LV560 2011 Holden VE Com Omega Wag Pet Auto 2X4 |
LV S/Wagon |
$38,830 |
$43,704 |
|||||||||
|
Light |
LV562 |
LV562 2011 Isuzu D Max D/C DSL Well Man 4x4 |
LV Utility D/Cab Well 4WD |
$33,765 |
$39,143 |
|||||||||
|
Light |
LV563 |
LV563 2011 Toyota Hilux D/C Well DSL Auto 4x4 |
LV Utility D/Cab Well 4WD |
$27,583 |
$30,141 |
$31,977 |
$34,942 |
|||||||
|
Light |
LV564 |
LV564 2011 Toyota Hiace Mini Bus |
Bus 8 Seat |
$39,885 |
$43,583 |
$49,053 |
||||||||
|
Light |
LV566 |
LV566 2011Toyota Camry Altise Sdn Auto 2x4 |
LV Sedan |
$26,225 |
$29,517 |
|||||||||
|
Light |
LV570 |
LV570 2912 Isuzu D Max S/C T/T DSL 4X2 |
LV Utility S/Cab Tray 2WD |
$27,000 |
$23,185 |
$26,878 |
||||||||
|
Misc. |
AE1 |
AE1 Alroh Tracaire Aerator |
Aerator |
|||||||||||
|
Misc. |
B7 |
B7 Cewell B200 Road Broom |
Broom Road |
$10,520 |
||||||||||
|
Misc. |
B8 |
B8 07 Sewell Road Broom TB 2000 with trailer |
Broom Road |
$53,539 |
$65,846 |
|||||||||
|
Misc. |
BP1 |
BP1 Boring Plant (Custom) |
Borer |
$33,744 |
||||||||||
|
Misc. |
GM3 |
GM3 07 Howard Pegasus Tri-deck Rollamowa |
Mower Roller |
$59,053 |
$70,512 |
|||||||||
|
Misc. |
GS8 |
GS8 Gesan DP60 Genset |
Generator |
$26,962 |
$32,194 |
|||||||||
|
Misc. |
LP1 |
LP1 Olymian Gel 17.5 Skid Mounted Generator |
Generator Skid Mount |
$21,432 |
||||||||||
|
Misc. |
LP2 |
LP2 Allight Generator Set KVA23 |
Generator |
$25,230 |
$30,126 |
|||||||||
|
Misc. |
MBA |
MBA1 Mustang Bobcat Attachment - Auger |
Loader Skid Steer Attachment |
$77,848 |
||||||||||
|
Misc. |
MBB |
MBB Mustang Bobcat Attachment - Broom |
Loader Skid Steer Attachment |
$16,211 |
||||||||||
|
Misc. |
MBP |
MBP Mustang Bobcat Attachment - Profiler |
Loader Skid Steer Attachment |
$16,211 |
||||||||||
|
Misc. |
MBR |
MBR Mustang Bobcat Attachment - Roller |
Loader Skid Steer Attachment |
$16,211 |
||||||||||
|
Misc. |
MR1 |
MR1 Collins 8T M/W Roller - Grasspatch |
Roller Multiwheel |
$71,643 |
||||||||||
|
Misc. |
MR2 |
MR2 Collins 8T M/W Roller - Cascades |
Roller Multiwheel |
$80,635 |
||||||||||
|
Misc. |
MR3 |
MR3 Collins 8T M/W Roller - Rural |
Roller Multiwheel |
$80,635 |
||||||||||
|
Misc. |
MR8 |
MR8 Custom M/W Roller - Condingup |
Roller Multiwheel |
$69,556 |
||||||||||
|
Misc. |
PREC2 |
PREC2 Precoater |
Precoater |
$45,020 |
||||||||||
|
Misc. |
SL5 |
SL5 99 Howard PEHD Rota Slasher (Town) |
Tractor Slasher |
$10,376 |
||||||||||
|
Misc. |
SL6 |
SL6 07 Howard EHD 210 Rota Slasher |
Tractor Slasher |
$12,604 |
$15,502 |
|||||||||
|
Misc. |
SU1 |
SU1 Accord Seeding Unit |
Tractor Seeder |
$7,913 |
||||||||||
|
Misc. |
TR27 |
TR27 08 Boxtop Trailer |
Trailer Boxtop |
|||||||||||
|
Misc. |
TR36 |
TR36 Trailer Mounted B/Spray |
Trailer Sprayer |
|||||||||||
|
Misc. |
TR41 |
TR41 Boxtop Trailer |
Trailer Boxtop |
|||||||||||
|
Misc. |
TR43 |
TR43 - Bobcat Trailer |
Trailer Boxtop |
|||||||||||
|
Misc. |
TR44 |
TR44 1200L Fuel Tanker - Tip |
Tanker Fuel |
|||||||||||
|
Misc. |
TR45 |
TR45 1998 1200L Fuel Tanker |
Tanker Fuel |
|||||||||||
|
Misc. |
TR46 |
TR46 - Custom Water Pump Trailer |
Trailer Pump |
|||||||||||
|
Misc. |
TR48 |
TR48 3200 Custom Made Fuel Tanker |
Tanker Fuel |
|||||||||||
|
Misc. |
TR49 |
TR49 Custom Made Ranger's Rubbish Trailer |
Trailer Rubbish |
|||||||||||
|
Misc. |
TR53 |
TR53 Custom Made 3200L Fuel Trailer |
Trailer Fuel |
|||||||||||
|
Misc. |
TR54 |
TR54 Bobcat & Profiler 7 tonne single axle trailer |
Trailer Skid Steer |
|||||||||||
|
Misc. |
TR55 |
TR55 - GM3900 Linelaser Sprayer |
Sprayer Linelaser |
$17,353 |
||||||||||
|
Misc. |
TR57 |
TR57 2003 Custom 3200L Fuel Tanker |
Tanker Fuel |
|||||||||||
|
Misc. |
TR61 |
TR61 2005 Tandem Axle Backhoe Trailer |
Trailer Skid Steer |
|||||||||||
|
Misc. |
TR66 |
TR66 2006 Single Axle Paint Trailer |
Trailer Paint |
|||||||||||
|
Misc. |
TR68 |
TR68 4500kg Plant Trailer |
Trailer Plant |
|||||||||||
|
Misc. |
TR69 |
TR69 08 Custom Fuel Trailer |
Trailer Fuel |
|||||||||||
|
Misc. |
TR70 |
TR70 2007 Custom Made Flat Top Trailer |
Trailer Flat Top |
|||||||||||
|
Misc. |
TR71 |
TR71 Graco Line Laser Sprayer |
Sprayer Linelaser |
|||||||||||
|
Misc. |
TR75 |
TR75 Transportable Radar Speed Display Trailer |
Trailer Speed Radar |
$19,546 |
||||||||||
|
Misc. |
TR76 |
TR76 Tandem Axle Water Tank Trailer (15,000 L) |
Trailer Water |
|||||||||||
|
Misc. |
TR79 |
TR79 2012 CSTMAC BOXTOP TRLR |
Trailer Boxtop |
|||||||||||
|
Misc. |
VM3 |
VM3 Turf Renovator |
Renovator Turf |
$41,768 |
$49,873 |
|||||||||
|
Misc. |
WP2 |
WP 26" water pump |
Pump Water 26" |
$12,395 |
||||||||||
|
2012 - 2013 |
2013 - 2014 |
2014 - 2015 |
2015 - 2016 |
2016 - 2017 |
2017 - 2018 |
2018 - 2019 |
2019 - 2020 |
2020- 2021 |
2021- 2022 |
2022 - 2023 |
||||
|
Total |
$1,390,830 |
$1,636,150 |
$1,311,676 |
$1,895,672 |
$1,435,530 |
$1,578,478 |
$1,430,946 |
$1,620,754 |
$1,615,522 |
$1,747,728 |
$1,778,176 |
|||
|
Heavy |
$1,022,600 |
$1,206,926 |
$1,156,487 |
$1,182,986 |
$1,176,326 |
$987,238 |
$961,683 |
$1,188,796 |
$1,207,169 |
$1,245,536 |
$1,117,601 |
|||
|
Light |
$343,000 |
$370,172 |
$144,813 |
$499,048 |
$189,648 |
$435,180 |
$469,263 |
$311,773 |
$296,678 |
$258,854 |
$579,228 |
|||
|
Misc. |
$25,230 |
$59,053 |
$10,376 |
$213,637 |
$69,556 |
$156,060 |
$0 |
$120,185 |
$111,676 |
$243,337 |
$81,348 |
|||
|
Attachment a.: Fleet Asset Management Plan 2013 |
Appendix C Planned Upgrade/Exp/New 10 year Capital Works Program
There are no New / Upgrade plans included in this AMP
Appendix D Core Risk Register
See attachment
Appendix E Abbreviations
|
AAAC |
Average annual asset consumption |
|
AMP |
Asset management plan |
|
ARI |
Average recurrence interval |
|
BOD |
Biochemical (biological) oxygen demand |
|
CRC |
Current replacement cost |
|
CWMS |
Community wastewater management systems |
|
DA |
Depreciable amount |
|
EF |
Earthworks/formation |
|
IRMP |
Infrastructure risk management plan |
|
LCC |
Life Cycle cost |
|
LCE |
Life cycle expenditure |
|
MMS |
Maintenance management system |
|
PCI |
Pavement condition index |
|
RV |
Residual value |
|
SS |
Suspended solids |
|
vph |
Vehicles per hour |
|
SOE |
Shire of Esperance |
Annual service cost (ASC)
1) Reporting actual cost
The annual (accrual) cost of providing a service including operations, maintenance, depreciation, finance/opportunity and disposal costs less revenue.
2) For investment analysis and budgeting
An estimate of the cost that would be tendered, per annum, if tenders were called for the supply of a service to a performance specification for a fixed term. The Annual Service Cost includes operations, maintenance, depreciation, finance/ opportunity and disposal costs, less revenue.
Asset
A resource controlled by an entity as a result of past events and from which future economic benefits are expected to flow to the entity. Infrastructure assets are a sub-class of property, plant and equipment which are non-current assets with a life greater than 12 months and enable services to be provided.
Asset class
A group of assets having a similar nature or function in the operations of an entity, and which, for purposes of disclosure, is shown as a single item without supplementary disclosure.
Asset condition assessment
The process of continuous or periodic inspection, assessment, measurement and interpretation of the resultant data to indicate the condition of a specific asset so as to determine the need for some preventative or remedial action.
Asset management (AM)
The combination of management, financial, economic, engineering and other practices applied to physical assets with the objective of providing the required level of service in the most cost effective manner.
Average annual asset consumption (AAAC)*
The amount of an organisation’s asset base consumed during a reporting period (generally a year). This may be calculated by dividing the depreciable amount by the useful life (or total future economic benefits/service potential) and totalled for each and every asset OR by dividing the carrying amount (depreciated replacement cost) by the remaining useful life (or remaining future economic benefits/service potential) and totalled for each and every asset in an asset category or class.
Borrowings
A borrowing or loan is a contractual obligation of the borrowing entity to deliver cash or another financial asset to the lending entity over a specified period of time or at a specified point in time, to cover both the initial capital provided and the cost of the interest incurred for providing this capital. A borrowing or loan provides the means for the borrowing entity to finance outlays (typically physical assets) when it has insufficient funds of its own to do so, and for the lending entity to make a financial return, normally in the form of interest revenue, on the funding provided.
Capital expenditure
Relatively large (material) expenditure, which has benefits, expected to last for more than 12 months. Capital expenditure includes renewal, expansion and upgrade. Where capital projects involve a combination of renewal, expansion and/or upgrade expenditures, the total project cost needs to be allocated accordingly.
Capital expenditure - expansion
Expenditure that extends the capacity of an existing asset to provide benefits, at the same standard as is currently enjoyed by existing beneficiaries, to a new group of users. It is discretionary expenditure, which increases future operations and maintenance costs, because it increases the organisation’s asset base, but may be associated with additional revenue from the new user group, eg. extending a drainage or road network, the provision of an oval or park in a new suburb for new residents.
Capital expenditure - new
Expenditure which creates a new asset providing a new service/output that did not exist beforehand. As it increases service potential it may impact revenue and will increase future operations and maintenance expenditure.
Capital expenditure - renewal
Expenditure on an existing asset or on replacing an existing asset, which returns the service capability of the asset up to that which it had originally. It is periodically required expenditure, relatively large (material) in value compared with the value of the components or sub-components of the asset being renewed. As it reinstates existing service potential, it generally has no impact on revenue, but may reduce future operations and maintenance expenditure if completed at the optimum time, eg. resurfacing or resheeting a material part of a road network, replacing a material section of a drainage network with pipes of the same capacity, resurfacing an oval.
Capital expenditure - upgrade
Expenditure, which enhances an existing asset to provide a higher level of service or expenditure that will increase the life of the asset beyond that which it had originally. Upgrade expenditure is discretionary and often does not result in additional revenue unless direct user charges apply. It will increase operations and maintenance expenditure in the future because of the increase in the organisation’s asset base, eg. widening the sealed area of an existing road, replacing drainage pipes with pipes of a greater capacity, enlarging a grandstand at a sporting facility.
Capital funding
Funding to pay for capital expenditure.
Capital grants
Monies received generally tied to the specific projects for which they are granted, which are often upgrade and/or expansion or new investment proposals.
Capital investment expenditure
See capital expenditure definition
Capitalisation threshold
The value of expenditure on non-current assets above which the expenditure is recognised as capital expenditure and below which the expenditure is charged as an expense in the year of acquisition.
Carrying amount
The amount at which an asset is recognised after deducting any accumulated depreciation / amortisation and accumulated impairment losses thereon.
Class of assets
See asset class definition
Component
Specific parts of an asset having independent physical or functional identity and having specific attributes such as different life expectancy, maintenance regimes, risk or criticality.
Cost of an asset
The amount of cash or cash equivalents paid or the fair value of the consideration given to acquire an asset at the time of its acquisition or construction, including any costs necessary to place the asset into service. This includes one-off design and project management costs.
Current replacement cost (CRC)
The cost the entity would incur to acquire the asset on the reporting date. The cost is measured by reference to the lowest cost at which the gross future economic benefits could be obtained in the normal course of business or the minimum it would cost, to replace the existing asset with a technologically modern equivalent new asset (not a second hand one) with the same economic benefits (gross service potential) allowing for any differences in the quantity and quality of output and in operating costs.
Depreciable amount
The cost of an asset, or other amount substituted for its cost, less its residual value.
Depreciated replacement cost (DRC)
The current replacement cost (CRC) of an asset less, where applicable, accumulated depreciation calculated on the basis of such cost to reflect the already consumed or expired future economic benefits of the asset.
Depreciation / amortisation
The systematic allocation of the depreciable amount (service potential) of an asset over its useful life.
Economic life
See useful life definition.
Expenditure
The spending of money on goods and services. Expenditure includes recurrent and capital.
Fair value
The amount for which an asset could be exchanged, or a liability settled, between knowledgeable, willing parties, in an arms length transaction.
Funding gap
A funding gap exists whenever an entity has insufficient capacity to fund asset renewal and other expenditure necessary to be able to appropriately maintain the range and level of services its existing asset stock was originally designed and intended to deliver. The service capability of the existing asset stock should be determined assuming no additional operating revenue, productivity improvements, or net financial liabilities above levels currently planned or projected. A current funding gap means service levels have already or are currently falling. A projected funding gap if not addressed will result in a future diminution of existing service levels.
Heritage asset
An asset with historic, artistic, scientific, technological, geographical or environmental qualities that is held and maintained principally for its contribution to knowledge and culture and this purpose is central to the objectives of the entity holding it.
Impairment Loss
The amount by which the carrying amount of an asset exceeds its recoverable amount.
Infrastructure assets
Physical assets that contribute to meeting the needs of organisations or the need for access to major economic and social facilities and services, eg. roads, drainage, footpaths and cycleways. These are typically large, interconnected networks or portfolios of composite assets. The components of these assets may be separately maintained, renewed or replaced individually so that the required level and standard of service from the network of assets is continuously sustained. Generally the components and hence the assets have long lives. They are fixed in place and are often have no separate market value.
Investment property
Property held to earn rentals or for capital appreciation or both, rather than for:
(a) use in the production or supply of goods or services or for administrative purposes; or
(b) sale in the ordinary course of business.
Key performance indicator
A qualitative or quantitative measure of a service or activity used to compare actual performance against a standard or other target. Performance indicators commonly relate to statutory limits, safety, responsiveness, cost, comfort, asset performance, reliability, efficiency, environmental protection and customer satisfaction.
Level of service
The defined service quality for a particular service/activity against which service performance may be measured. Service levels usually relate to quality, quantity, reliability, responsiveness, environmental impact, acceptability and cost.
Life Cycle Cost
1. Total LCC The total cost of an asset throughout its life including planning, design, construction, acquisition, operation, maintenance, rehabilitation and disposal costs.
2. Average LCC The life cycle cost (LCC) is average cost to provide the service over the longest asset life cycle. It comprises annual operations, maintenance and asset consumption expense, represented by depreciation expense. The Life Cycle Cost does not indicate the funds required to provide the service in a particular year.
Life Cycle Expenditure
The Life Cycle Expenditure (LCE) is the actual or planned annual operations, maintenance and capital renewal expenditure incurred in providing the service in a particular year. Life Cycle Expenditure may be compared to average Life Cycle Cost to give an initial indicator of life cycle sustainability.
Loans / borrowings
See borrowings.
Maintenance
All actions necessary for retaining an asset as near as practicable to its original condition, including regular ongoing day-to-day work necessary to keep assets operating, eg road patching but excluding rehabilitation or renewal. It is operating expenditure required to ensure that the asset reaches its expected useful life.
• Planned maintenance
Repair work that is identified and managed through a maintenance management system (MMS). MMS activities include inspection, assessing the condition against failure/breakdown criteria/experience, prioritising scheduling, actioning the work and reporting what was done to develop a maintenance history and improve maintenance and service delivery performance.
• Reactive maintenance
Unplanned repair work that is carried out in response to service requests and management/supervisory directions.
• Significant maintenance
Maintenance work to repair components or replace sub-components that needs to be identified as a specific maintenance item in the maintenance budget.
• Unplanned maintenance
Corrective work required in the short-term to restore an asset to working condition so it can continue to deliver the required service or to maintain its level of security and integrity.
Maintenance and renewal gap
Difference between estimated budgets and projected required expenditures for maintenance and renewal of assets to achieve/maintain specified service levels, totalled over a defined time (e.g. 5, 10 and 15 years).
Maintenance and renewal sustainability index
Ratio of estimated budget to projected expenditure for maintenance and renewal of assets over a defined time (eg 5, 10 and 15 years).
Maintenance expenditure
Recurrent expenditure, which is periodically or regularly required as part of the anticipated schedule of works required to ensure that the asset achieves its useful life and provides the required level of service. It is expenditure, which was anticipated in determining the asset’s useful life.
Materiality
The notion of materiality guides the margin of error acceptable, the degree of precision required and the extent of the disclosure required when preparing general purpose financial reports. Information is material if its omission, misstatement or non-disclosure has the potential, individually or collectively, to influence the economic decisions of users taken on the basis of the financial report or affect the discharge of accountability by the management or governing body of the entity.
Modern equivalent asset
Assets that replicate what is in existence with the most cost-effective asset performing the same level of service. It is the most cost efficient, currently available asset which will provide the same stream of services as the existing asset is capable of producing. It allows for technology changes and, improvements and efficiencies in production and installation techniques
Net present value (NPV)
The value to the organisation of the cash flows associated with an asset, liability, activity or event calculated using a discount rate to reflect the time value of money. It is the net amount of discounted total cash inflows after deducting the value of the discounted total cash outflows arising from eg the continued use and subsequent disposal of the asset after deducting the value of the discounted total cash outflows.
Non-revenue generating investments
Investments for the provision of goods and services to sustain or improve services to the community that are not expected to generate any savings or revenue to the Council, eg. parks and playgrounds, footpaths, roads and bridges, libraries, etc.
Operations expenditure
Recurrent expenditure, which is continuously required to provide a service. In common use the term typically includes, eg power, fuel, staff, plant equipment, on-costs and overheads but excludes maintenance and depreciation. Maintenance and depreciation is on the other hand included in operating expenses.
Operating expense
The gross outflow of economic benefits, being cash and non cash items, during the period arising in the course of ordinary activities of an entity when those outflows result in decreases in equity, other than decreases relating to distributions to equity participants.
Pavement management system
A systematic process for measuring and predicting the condition of road pavements and wearing surfaces over time and recommending corrective actions.
PMS Score
A measure of condition of a road segment determined from a Pavement Management System.
Rate of annual asset consumption
A measure of average annual consumption of assets (AAAC) expressed as a percentage of the depreciable amount (AAAC/DA). Depreciation may be used for AAAC.
Rate of annual asset renewal
A measure of the rate at which assets are being renewed per annum expressed as a percentage of depreciable amount (capital renewal expenditure/DA).
Rate of annual asset upgrade
A measure of the rate at which assets are being upgraded and expanded per annum expressed as a percentage of depreciable amount (capital upgrade/expansion expenditure/DA).
Recoverable amount
The higher of an asset's fair value, less costs to sell and its value in use.
Recurrent expenditure
Relatively small (immaterial) expenditure or that which has benefits expected to last less than 12 months. Recurrent expenditure includes operations and maintenance expenditure.
Recurrent funding
Funding to pay for recurrent expenditure.
Rehabilitation
See capital renewal expenditure definition above.
Remaining useful life
The time remaining until an asset ceases to provide the required service level or economic usefulness. Age plus remaining useful life is useful life.
Renewal
See capital renewal expenditure definition above.
Residual value
The estimated amount that an entity would currently obtain from disposal of the asset, after deducting the estimated costs of disposal, if the asset were already of the age and in the condition expected at the end of its useful life.
Revenue generating investments
Investments for the provision of goods and services to sustain or improve services to the community that are expected to generate some savings or revenue to offset operating costs, eg public halls and theatres, childcare centres, sporting and Fleet facilities, tourist information centres, etc.
Risk management
The application of a formal process to the range of possible values relating to key factors associated with a risk in order to determine the resultant ranges of outcomes and their probability of occurrence.
Section or segment
A self-contained part or piece of an infrastructure asset.
Service potential
The total future service capacity of an asset. It is normally determined by reference to the operating capacity and economic life of an asset. A measure of service potential is used in the not-for-profit sector/public sector to value assets, particularly those not producing a cash flow.
Service potential remaining
A measure of the future economic benefits remaining in assets. It may be expressed in dollar values (Fair Value) or as a percentage of total anticipated future economic benefits. It is also a measure of the percentage of the asset’s potential to provide services that is still available for use in providing services (Depreciated Replacement Cost/Depreciable Amount).
Strategic Longer-Term Plan
A plan covering the term of office of councillors (4 years minimum) reflecting the needs of the community for the foreseeable future. It brings together the detailed requirements in the council’s longer-term plans such as the asset management plan and the long-term financial plan. The plan is prepared in consultation with the community and details where the council is at that point in time, where it wants to go, how it is going to get there, mechanisms for monitoring the achievement of the outcomes and how the plan will be resourced.
Specific Maintenance
Replacement of higher value components/sub-components of assets that is undertaken on a regular cycle including repainting, building roof replacement, cycle, replacement of air conditioning equipment, etc. This work generally falls below the capital/ maintenance threshold and needs to be identified in a specific maintenance budget allocation.
Sub-component
Smaller individual parts that make up a component part.
Useful life
Either:
(a) the period over which an asset is expected to be available for use by an entity, or
(b) the number of production or similar units expected to be obtained from the asset by the entity.
It is estimated or expected time between placing the asset into service and removing it from service, or the estimated period of time over which the future economic benefits embodied in a depreciable asset, are expected to be consumed by the council.
Value in Use
The present value of future cash flows expected to be derived from an asset or cash generating unit. It is deemed to be depreciated replacement cost (DRC) for those assets whose future economic benefits are not primarily dependent on the asset's ability to generate net cash inflows, where the entity would, if deprived of the asset, replace its remaining future economic benefits.